Getting Started
Vampir is available for all major platforms. Its installation process depends on the target operation system. The following sections explain the particular installation steps for each system.
Linux, Unix
An installer package is provided for Linux/Unix systems. To install Vampir run the installer from the command line.
./vampir-8.0.0-standard-linux-ia32-setup.bin
Additional instructions are provided during installation. For an overview of all available options run the installer package with the option --help.
It is possible to run the installer in silent (unattended) mode with the -s command line option. In this case the installer assumes default values for all options.
By default, the installer associates Vampir with OTF and OTF2 files (*.otf, *.otf2). This allows to quickly open a trace file by double-clicking its master file. Furthermore, a desktop icon and a desktop dependent menu items are generated.
During the first start of Vampir the license installation is completed.
Finally, Vampir can be launched via the respective desktop icon or by using the command line interface (see Section LINK).
Mac OS X
Open the .dmg installation package and drag the Vampir icon into the applications folder on your computer. You might need administrator rights to do so. Alternatively, you can also drag the Vampir application to another directory that is writable for you. After that, double click on the Vampir application and follow the instructions for license installation.
Windows
On Windows platforms the provided Vampir installer makes the installation very simple and straightforward. Just run the installer and follow the installation wizard. Install Vampir in a folder of your choice, e.g.:
C:\Program Files
In order to run the installer in silent (unattended) mode use the /S option. It is also possible to specify the output folder of the installation with /D=dir. An example of a silent installation command is as follows:
Vampir-8.0.0-Standard-x86-setup.exe /S /D=C:\Program Files
You also have the option to associate Vampir with OTF and OTF2 files (*.otf, *.otf2) during the installation process. This allows you to load a trace file quickly by double-clicking its master file. Subsequently, Vampir can be launched by double-clicking its icon or by using the command line interface (see Chapter LINK).
At the first start Vampir will display instructions for license installation.
Generation of Performance Data
The generation of trace log files for the Vampir performance visualization tool requires a working monitoring system to be attached to your parallel program. The following software packages provide compatible monitoring systems with built-in support for the Vampir performance data file format.
Score-P
Score-P is the recommended code instrumentation and run-time measurement framework for Vampir8. The goal of Score-P is to simplify the analysis of the behavior of high performance computing software and to allow the developers of such software to find out where and why performance problems arise, where bottlenecks may be expected and where their codes offer room for further improvements with respect to the run time. A number of tools have been around to help in this respect, but typically each of these tools has only handled a certain subset of the questions of interest. A crucial problem in the traditional approach used to be the fact that each analysis tool had its own instrumentation system, so the user was commonly forced to repeat the instrumentation procedure if more than one tool was to be employed. In this context, Score-P offers the user a maximum of convenience by providing the Opari2 instrumentor as a common infrastructure for a number of analysis tools like Periscope, Scalasca, Vampir, and Tau that obviates the need for multiple repetitions of the instrumentation and thus substantially reduces the amount of work required. It is open for other tools as well. Moreover, Score-P provides the new Open Trace Format Version 2 (OTF2) for the tracing data and the new CUBE4 profiling data format which allow a better scaling of the tools with respect to both the run time of the process to be analyzed and the number of cores to be used. Score-P supports the programming paradigms serial, OpenMP, MPI, and hybrid (MPI combined with OpenMP).
Internally, the instrumentation itself will insert special measurement calls into the application code at specific important points (events).
This can be done in an almost automatic way using corresponding features of typical compilers, but also semi-automatically or in a fully manual way, thus giving the user complete control of the process.
In general, an automatic instrumentation is most convenient for the user.
This is done by using the scorep command that needs to be prefixed to all the compile and link commands usually employed to build the application.
Thus, an application executable app that is normally generated from the two source files app1.f90 and app2.f90 via the command:
mpif90 app1.f90 app2.f90 -o app
will now be built by:
scorep mpif90 app1.f90 app2.f90 -o app
using the Score-P instrumentor.
When makefiles are employed to build the application, it is convenient to define a placeholder variable to indicate whether a preparation step like an instrumentation is desired or only the pure compilation and linking.
For example, if this variable is called PREP then the lines defining the C compiler in the makefile can be changed from:
MPICC = mpicc
to
MPICC = $(PREP) mpicc
(and analogously for linkers and other compilers). One can then use the same makefile to either build an instrumented version with the
make PREP=scorep
command or a fully optimized and not instrumented default build by simply using:
make
in the standard way, i.e. without specifying PREP on the command line.
Detailed information about the installation and usage of Score-P can be found in the Score-P user manual.
VampirTrace
VampirTrace used to be the recommended monitoring facility for Vampir. It is still available as Open Source software but no longer under active development (see Score-P Section LINK). During a program run of an application, VampirTrace generates an OTF trace file, which can be analyzed and visualized by Vampir. The VampirTrace library allows MPI communication events of a parallel program to be recorded in a trace file. Additionally, certain program-specific events can be included. To record MPI communication events, simply re-link the program with the VampirTrace library. A new compilation of the program source code is only necessary if program specific events should be added.
To perform measurements with VampirTrace, the application program needs to be instrumented, which is done automatically. All the necessary instrumentation steps are handled by the compiler wrappers of VampirTrace (vtcc, vtcxx, vtf77, vtf90 and the additional wrappers mpicc-vt, mpicxx-vt, mpif77-vt, and mpif90-vt in Open MPI 1.3). All compile and link commands in the used makefile should be replaced by the VampirTrace compiler wrapper, which performs the necessary instrumentation of the program and links the suitable VampirTrace library. Simply use the compiler wrappers without any parameters, e.g.:
vtf90 hello.f90 -o hello
Running a VampirTrace instrumented application results in an OTF trace file stored the current working directory where the application was executed.
On Linux, Mac OS X, and Sun Solaris the default name of the trace file will be equal to the application name.
For other systems, the default name is a.otf but can be defined manually by setting the environment variable VT_FILE_PREFIX to the desired name.
Detailed information about the installation and usage of VampirTrace can be found in the VampirTrace user manual.
Event Tracing for Windows (ETW)
The Event Tracing for Windows (ETW) infrastructure of the Windows client and server OS's provides a powerful software monitor. Starting with Windows HPC Server 2008 MS-MPI has built-in support for this monitor. It enables application developers to quickly produce traces in production environments by simply adding an extra mpiexec flag (-trace). Trace files will be generated during the execution of your application. The recorded trace log files include the following events: Any MS-MPI application call and low-level communication within sockets, shared memory, and NetworkDirect implementations. Each event includes a high-precision CPU clock timer for precise visualization and analysis.
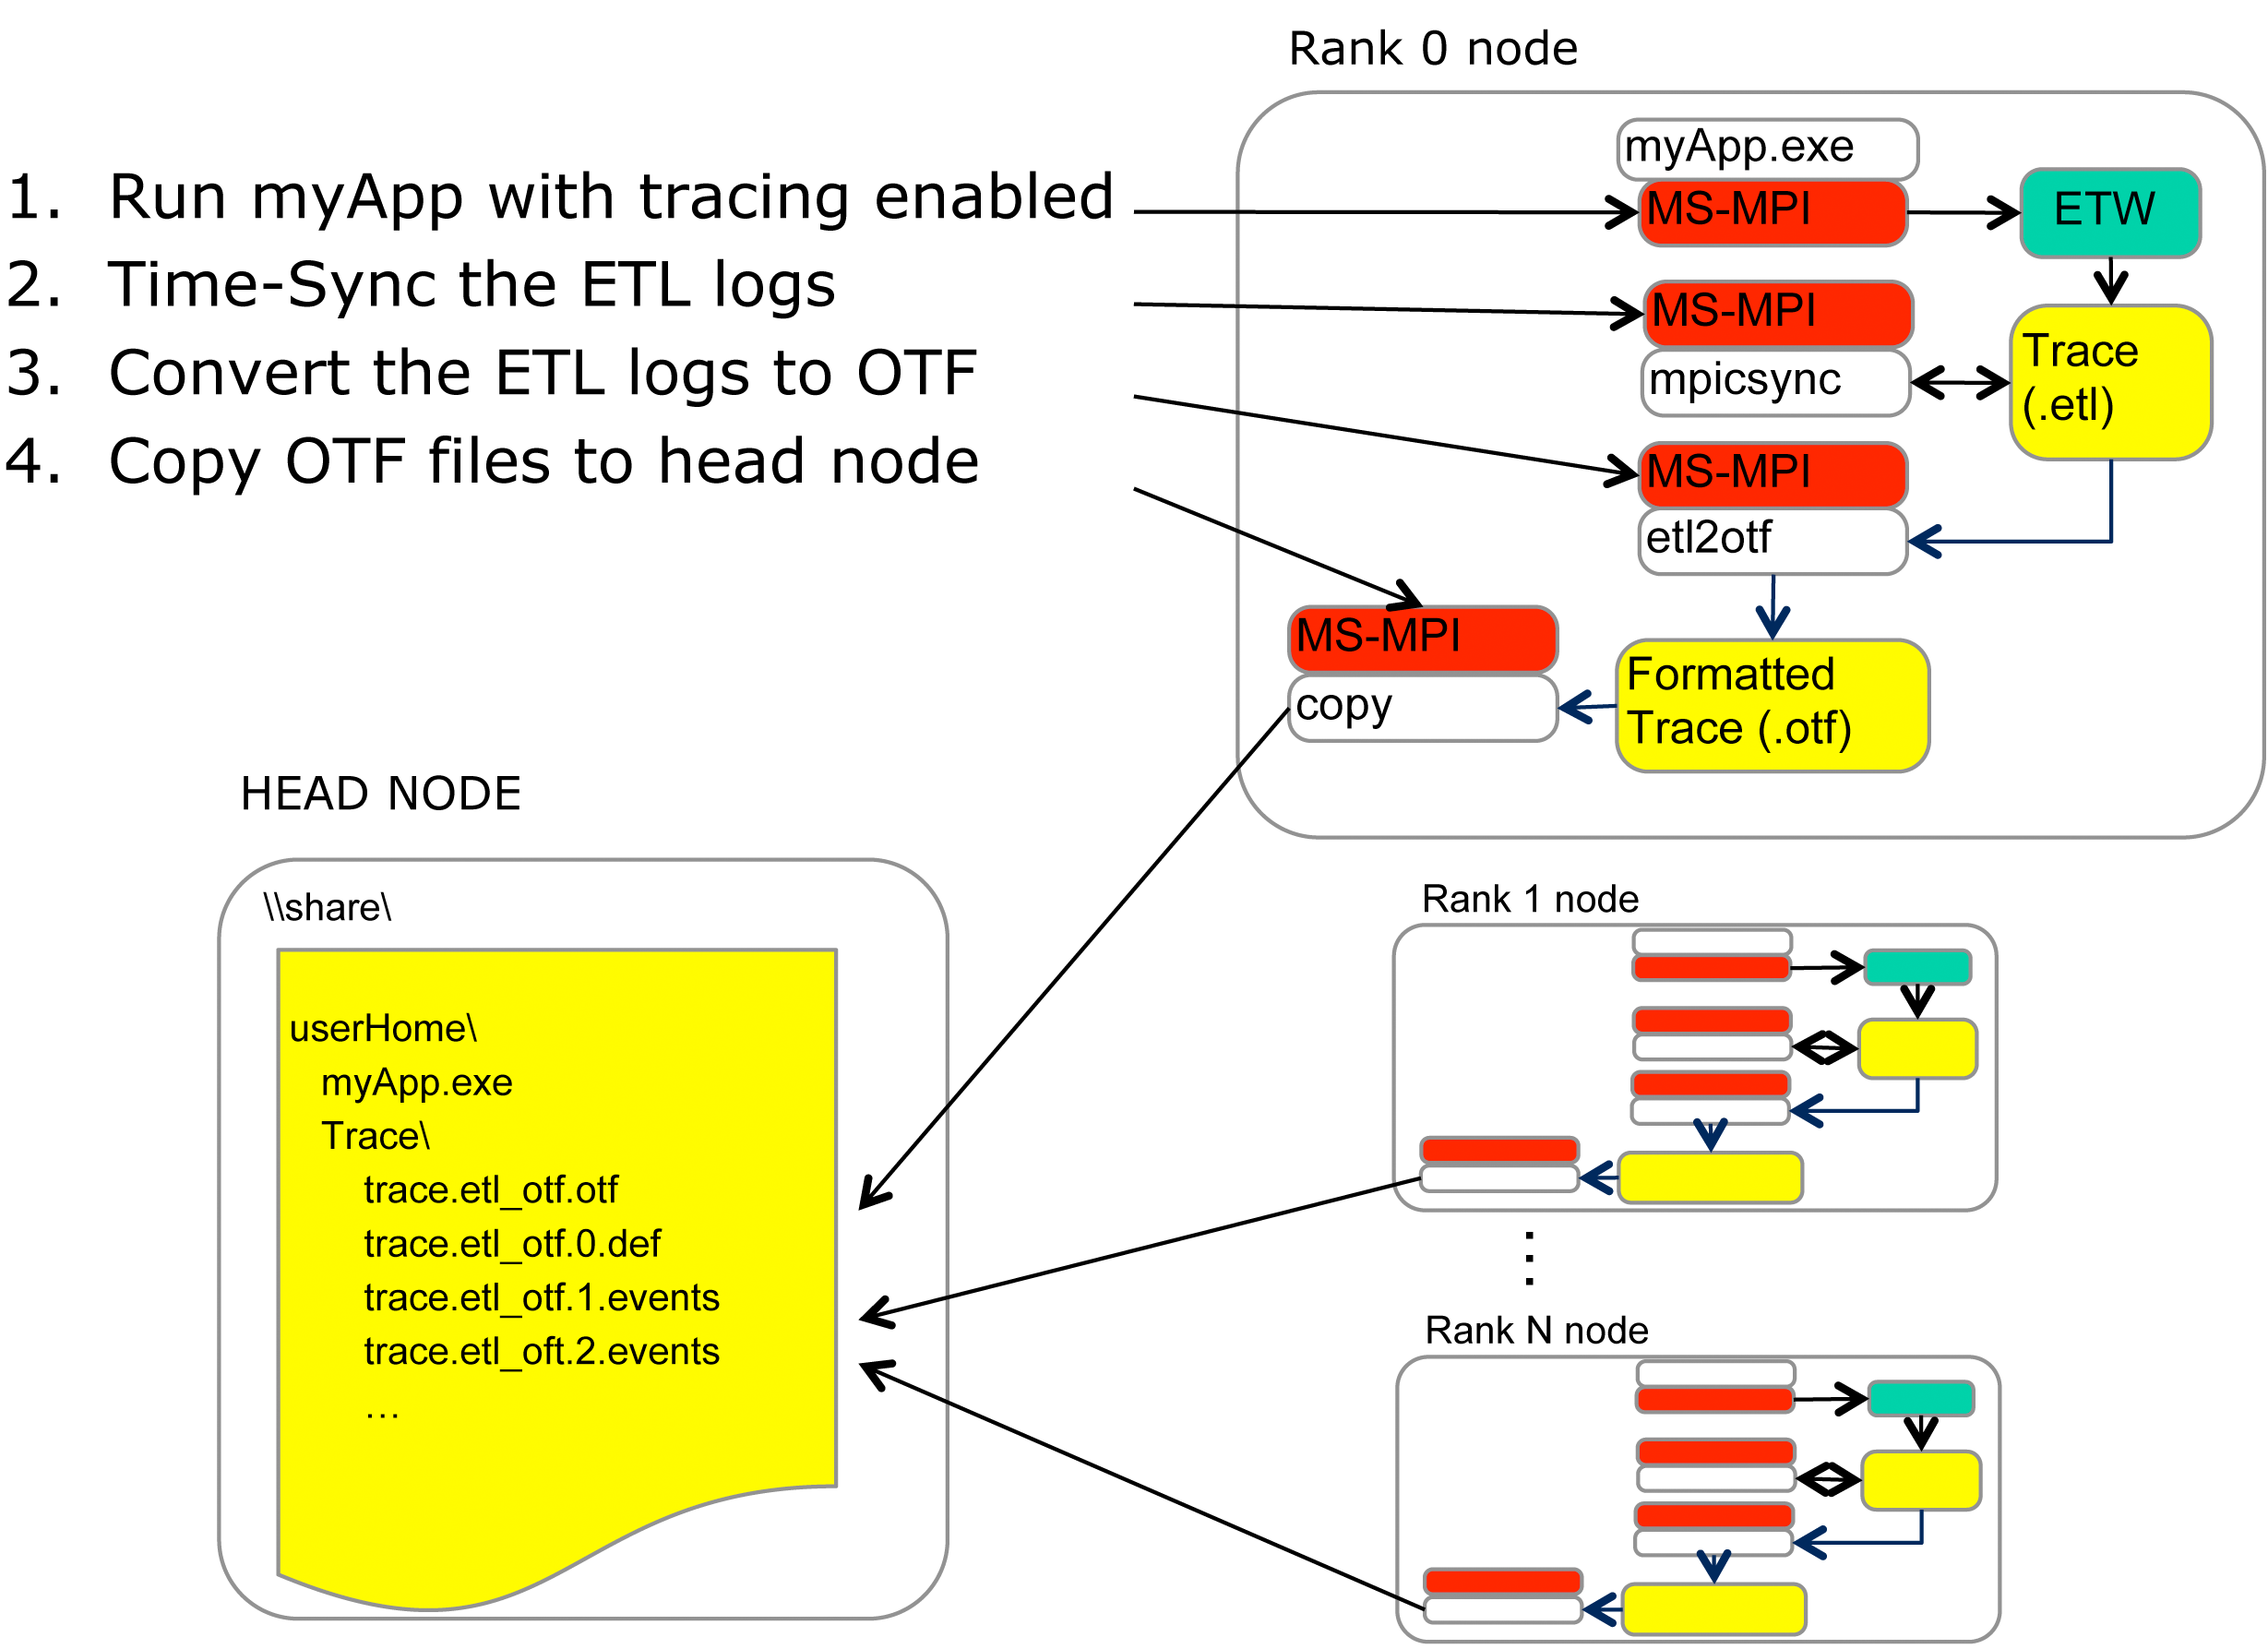
The steps necessary for monitoring the MPI performance of an MS-MPI application are depicted in Figure LINK. First the application needs to be available throughout all compute nodes in the cluster and has to be started with tracing enabled. The Event Tracing for Windows (ETW) infrastructure writes event logs (.etl files) containing the respective MPI events of the application on each compute node. In order to achieve consistent event data across all compute nodes clock corrections need to be applied. This step is performed after the successful run of the application using the Microsoft tool mpicsync. Now the event log files can be converted into OTF files with help of the tool etl2otf. The last necessary step is to copy the generated OTF files from the compute nodes into one shared directory. Then this directory includes all files needed by Vampir. The application performance can be analyzed now.

MS-MPI Tracing Overview
The following commands illustrate the procedure described above and show, as a practical example, how to trace an application on the Windows HPC Server 2008. For proper utilization and thus successful tracing, the file system of the cluster needs to meet the following prerequisites:
\\share\userHomeis the shared user directory throughout the cluster- MS-MPI executable
myApp.exeis available in the shared directory \\share\userHome\Traceis the directory where the OTF files are collected
1. Launch application with tracing enabled (use of -tracefile option):
mpiexec -wdir \\share\userHome\ \\ -tracefile %USERPROFILE%\trace.etl myApp.exe
-wdirsets the working directory;myApp.exehas to be there%USERPROFILE%translates to the local home directory, e.g.
C:\Users\userHome; on each compute node the event log file (.etl) is stored locally in this directory
2. Time-sync the event log files throughout all compute nodes:
mpiexec -cores 1 -wdir %USERPROFILE% mpicsync trace.etl
-cores 1: run only one instance of mpicsync on each compute node
3. Format the event log files to OTF files:
mpiexec -cores 1 -wdir %USERPROFILE% etl2otf trace.etl
4. Copy all OTF files from compute nodes to trace directory on share:
mpiexec -cores 1 -wdir %USERPROFILE% cmd /c copy /y
*_otf* \\share\userHome\Trace
Starting Vampir and Loading Performance Data

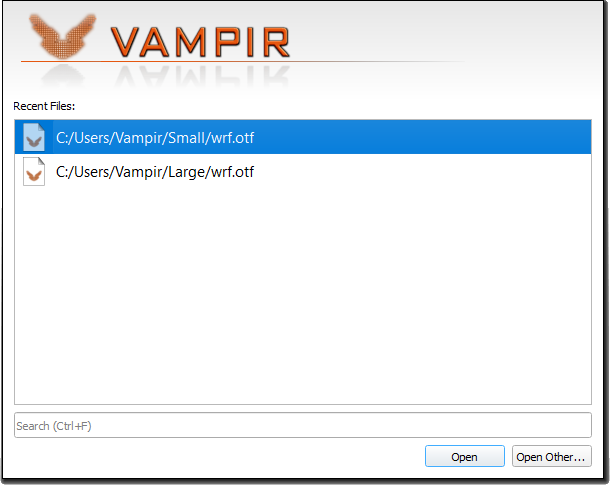
List of recent trace files
Viewing performance data with the Vampir GUI is very easy. On Windows the tool can be started by double clicking its desktop icon (if installed) or by using the Start Menu. On a Linux-based machine run ./vampir in the directory where Vampir is installed. A double click on the application icon opens Vampir on Mac OS X systems.
At startup Vampir presents a list of recently loaded trace files as depicted in Figure LINK. Selecting a list entry and clicking the Open button loads the respective trace. The recent list is empty when Vampir is started for the first time.
Loading a Trace File
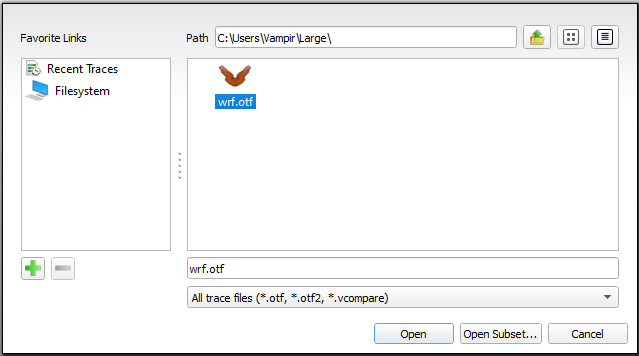
To open an arbitrary trace file, click on Open Other... or select Open... in the File menu, which provides the file open dialog depicted in Figure LINK.

Loading a trace file in Vampir
It is possible to filter the files in the list. The file type input selector determines the visible files. The default is All trace files (*.otf, *.otf2, *.elg, *.esd), which only shows trace files that can be processed by the tool. All file types can be displayed by using All Files (*).
After selection of the trace file the loading process is started by a click on the Open button. Alternatively, a command line invocation is possible. The following command line sequence shows an example for a Windows system. Other platforms work accordingly.
C:\Program Files\Vampir\Vampir.exe [trace file]
To open multiple trace files at once you can give them one after another as command line arguments:
C:\Program Files\Vampir\Vampir.exe [file 1]...[file n]
If Vampir was associated with *.otf/*.otf2 files during the installation process, it is also possible to start the application by double-clicking an *.otf/*.otf2 file.
While Vampir is loading the trace file, an empty Trace View window with a progress bar at the bottom opens. After Vampir loaded the trace data completely, a default set of charts will appear. The loading process can be interrupted at any time by clicking the cancel button in the lower right corner of the Trace View. Because events in the trace file are loaded one after another, the GUI will open and show the earliest, already loaded information from the trace file.
The basic functionality and navigation elements of the GUI are described in Chapter LINK. The available charts and the information provided by them are explained in Chapter LINK.
Loading a Trace File Subset
To handle large trace files and save time and memory resources, it is possible to load only a performance data subset from a trace file.
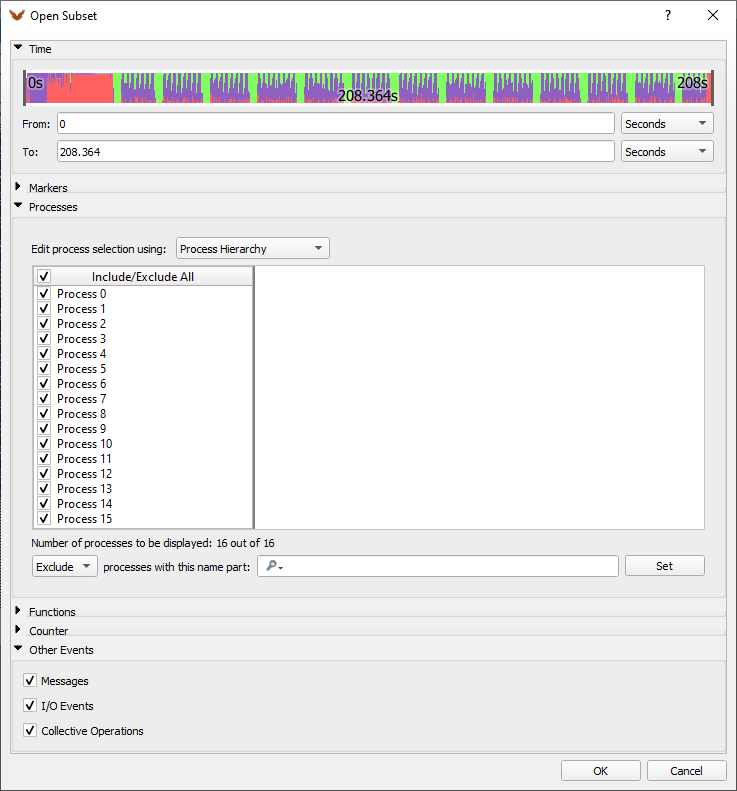
For this purpose the open dialog, Figure LINK, provides the button Open Subset.... Clicking on this button opens a trace data pre-selection dialog, depicted in Figure LINK.

Selecting a trace data subset to be loaded
An overview snapshot of the recorded application run is given at the top of the dialog. The time range of interest can be set with the markers on the left and right of the overview snapshot. Likewise, the time range to be loaded can be set explicitly in the input fields From: and To:. If markers are available in the trace file, their timing information can be used as reference points as well. Once the time range of interest is specified a click on the OK button starts the loading process.