Basics
After loading has been completed, the Trace View window title displays the trace file's name as depicted in Figure LINK. By default the Charts toolbar and the Zoom Toolbar are available.
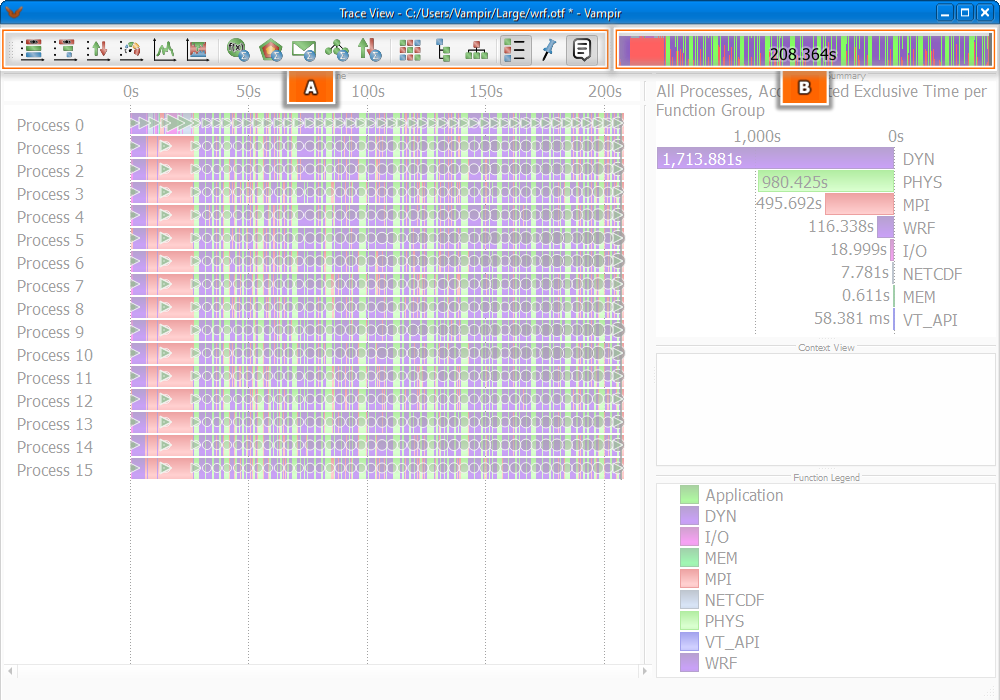
Trace View Window with Charts Toolbar(A) and Zoom Toolbar(B)
Furthermore, a default set of charts is opened automatically after loading has been finished. The charts can be divided into three groups: timeline-, statistical-, and informational charts. Timeline charts show detailed event based information for arbitrary time intervals while statistical charts reveal accumulated measures which were computed from the corresponding event data. Informational charts provide additional or explanatory information regarding timeline- and statistical charts. All available charts can be opened with the Charts toolbar which is explained in Chapter LINK.
In the following sections we will explain the basic functions of the Vampir GUI which are generic to all charts. If you are already familiar with the fundamentals feel free to skip this chapter. The details of the different charts are explained in Chapter LINK.
Chart Arrangement
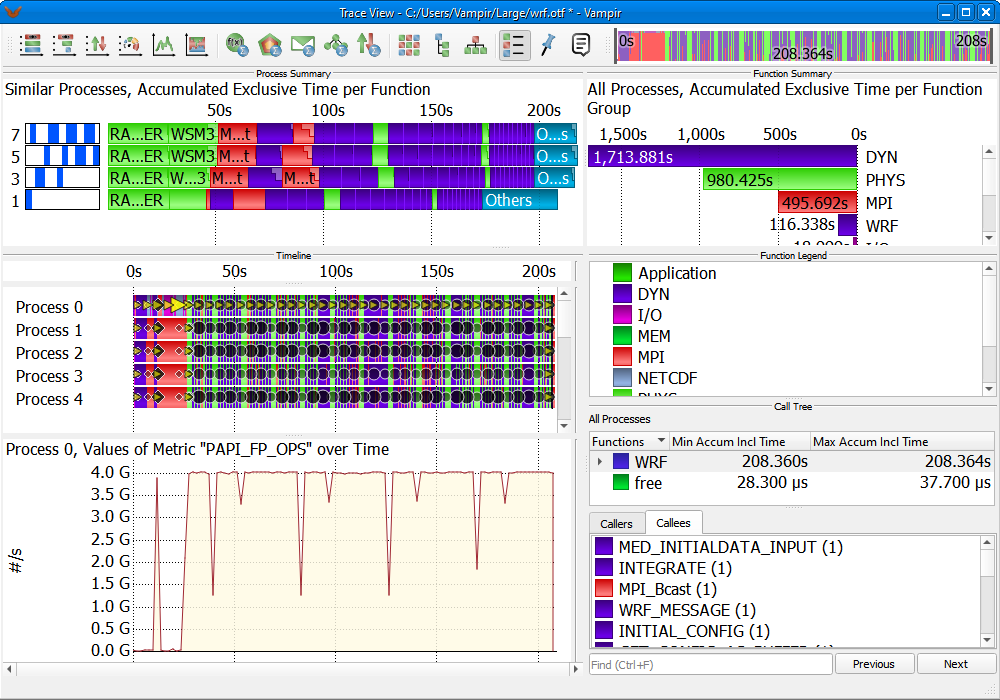
A Custom Chart Arrangement in the Trace View Window
The utility of charts can be increased by correlating them and their provided information. Vampir supports this mode of operation by allowing to display multiple charts at the same time. All timeline charts, such as the Master Timeline and the Process Timeline display a sequence of events. Those charts are therefore aligned vertically. This alignment ensures that the temporal relationship of events is preserved across chart boundaries.
The user can arrange the placement of the charts according to his preferences by dragging them into the desired position. When the left mouse button is pressed while the mouse pointer is located above a placement decoration, the layout engine will give visual clues as to where the chart may be moved. As soon as the user releases the left mouse button the chart arrangement will be changed according to his intentions. The entire procedure is depicted in Figures LINK and LINK.
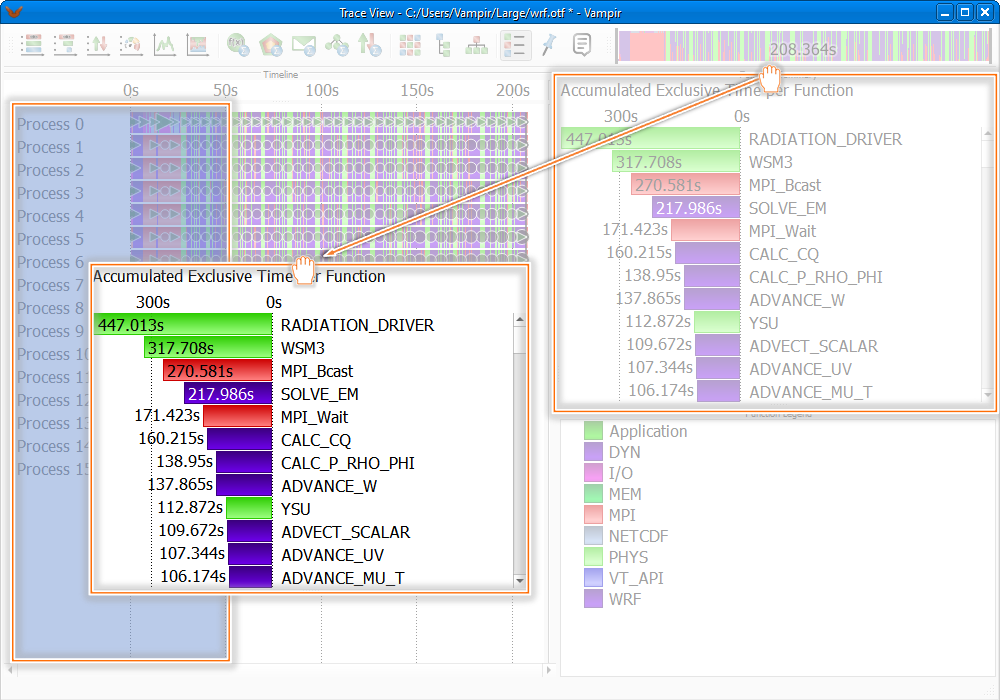
Moving and Arranging Charts in the Trace View Window(1)
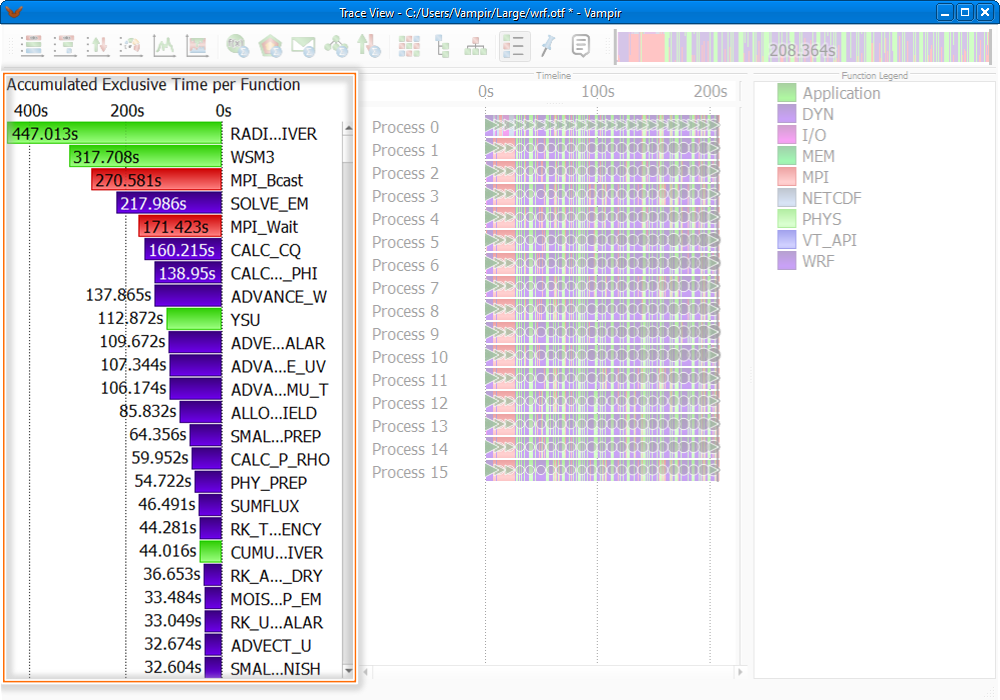
Moving and Arranging Charts in the Trace View Window(2)
The layout engine furthermore allows a flexible adjustment of the screen space that is used by a chart. Charts of particular interest may get more space in order to render information in more detail.
The Trace View window can host an arbitrary number of charts. Charts can be added by clicking on the respective icon in the Charts toolbar or the corresponding Chart menu entry. With a few more clicks, charts can be combined to a custom chart arrangement as depicted in Figure LINK. Customized layouts can be saved as described in Chapter LINK.
Every chart can be undocked or closed by clicking the dedicated icon in its upper right corner as shown in Figure LINK. Undocking a chart means to free the chart from the current arrangement and present it in an own window. To dock/undock a chart follow Figure LINK, respectively Figure LINK.
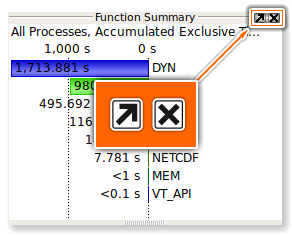
Closing (right) and Undocking (left) of a Chart
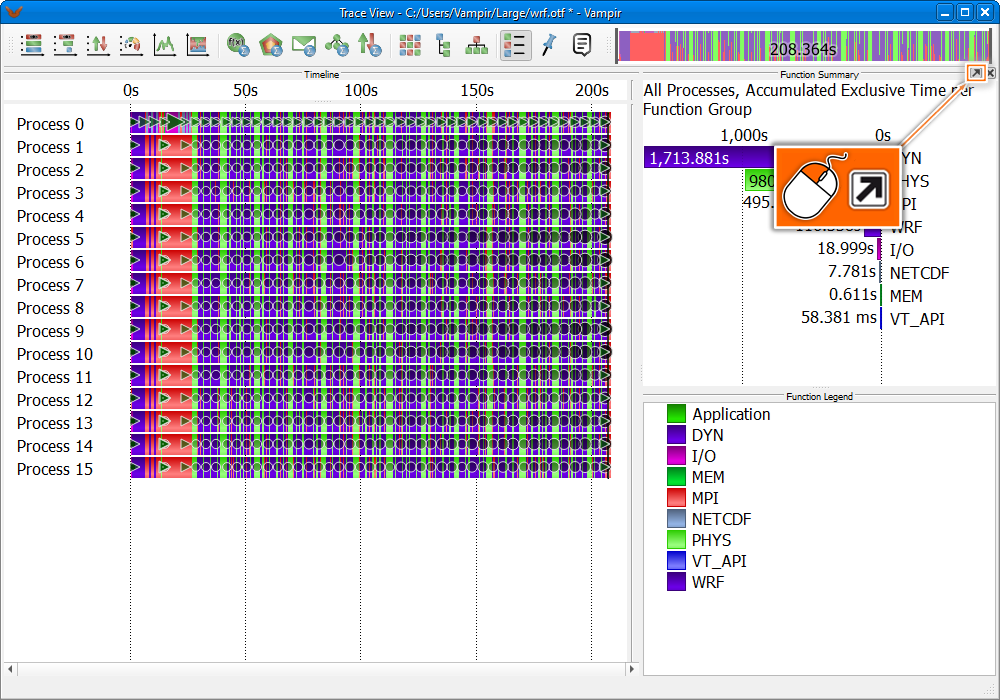
Undocking of a Chart
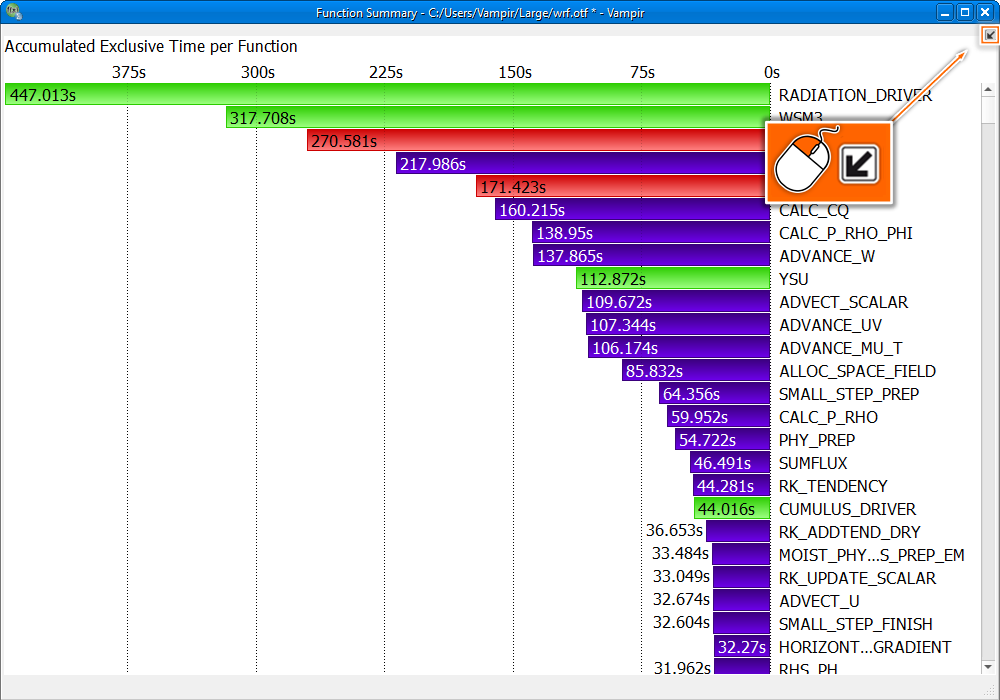
Docking of a Chart
Considering that labels, e.g., those showing names or values of functions often need more space to show its whole text, there is a further option of resizing. In order to read labels completely, it might be useful to alter the distribution of space shared by the labels and the graphical representation in a chart. When hovering the blank space between labels and graphical representation, a movable separator appears. By dragging the separator decoration with the left mouse button the chart space provided for the labels can be resized. The whole process is illustrated in Figure LINK.
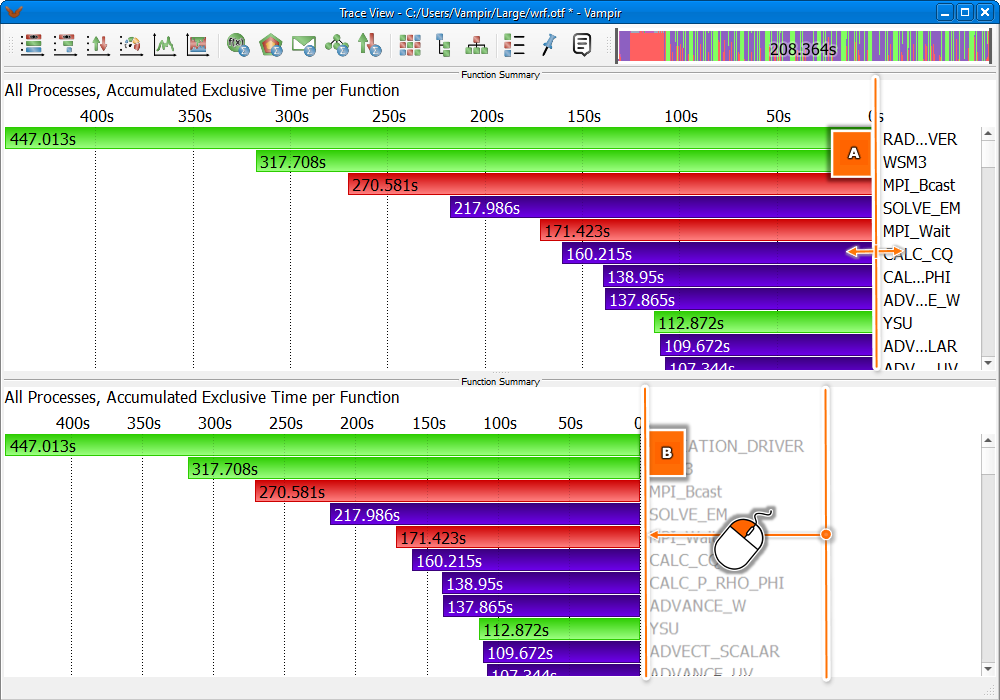
Resizing Labels: (A) Hover a Separator Decoration; (B) Drag and Drop the Separator
Context Menus
All chart displays have their own context menu containing common as well as display specific entries. In this section only the most common entries will be discussed. A context menu can be accessed by right clicking anywhere in the chart window.
Common entries are:
- Reset Zoom: Go back to the initial state in horizontal zooming.
- Reset Vertical Zoom: Go back to the initial state in vertical zooming.
- Set Metric: Set the values which should be represented in the chart, e.g., change from Exclusive Time to Inclusive Time.
- Sort By: Rearrange values or bars by a certain characteristic.
Zooming
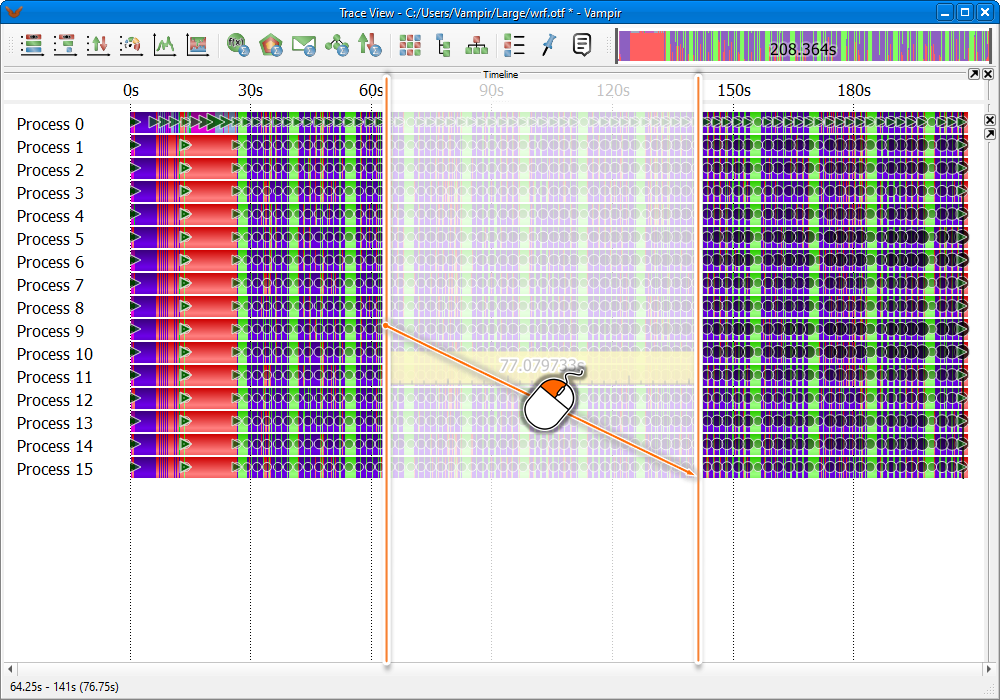
Zooming within a Chart
Zooming is a key feature of Vampir. In most charts it is possible to zoom in and out to get detailed or abstract views of the visualized data.
In the timeline charts zooming produces a more detailed view of a selected time interval and therefore reveals new information that was previously hidden in the larger section. Short function calls in the Master Timeline may not be visible unless an appropriate zooming level has been reached. In other words, if the execution time of functions is too short with respect to the available pixel resolution of your computer display, zooming into a shorter time interval is required in order to make them visible.
Note: Other charts are affected by zooming in the timeline displays. The interval chosen in a timeline chart, such as Master Timeline or Process Timeline also defines the time interval for the calculation of accumulated measurements in the statistical charts.
Statistical charts like the Function Summary provide zooming of statistic values. In these cases zooming does not affect any other chart. Zooming is disabled in the Pie Chart mode of the Function Summary accessible via the context menu under Set Chart Mode -> Pie Chart.
To zoom into an area, click and hold the left mouse button and select the area as shown in Figure LINK. It is possible to zoom horizontally and in some charts also vertically. In the Master Timeline horizontal zooming defines the time interval to be visualized whereas vertical zooming selects a group of processes to be displayed. To scroll horizontally move the slider at the bottom or use the mouse wheel. To get back to the initial state of zooming select Reset Horizontal Zoom or Reset Vertical Zoom (see Section \ref{sec:contextmenu}) in the context menu of the respective performance chart.
Additionally the zoom can be accessed with help of the Zoom Toolbar by dragging the borders of the selection rectangle or by scrolling of the mouse wheel as described in Chapter LINK.
In order to return to the previous zooming state an undo functionality, accessible via the Edit menu, is provided. Alternatively, the key combination Ctrl+Z also reverts the last zoom. Accordingly, a reverted zooming action can be redone by selecting Redo in the Edit menu or by pressing Ctrl+Shift+Z. The undo functionality is not bound to single performance charts but works across the entire application. The labels of the Undo and Redo menu entries also state which kind of action will be undone/redone next.
The Zoom Toolbar
Vampir provides a Zoom Toolbar that can be used for zooming and navigation in the trace data. It is located in the upper right corner of the Trace View window, shown in Figure LINK. It is possible to adjust its position via drag and drop. The Zoom Toolbar offers an overview and summary of the loaded trace data. The currently zoomed area is highlighted as a rectangle within the Zoom Toolbar. By dragging of the two boundaries of the highlighted rectangle the horizontal zooming state can be adjusted.
Note: Instead of dragging boundaries it is also possible to use the mouse wheel for zooming. Hover the Zoom Toolbar and scroll up and down to zoom in and out, respectively.
Dragging the zoom area changes the section that is displayed without changing the zoom factor. For dragging, click into the highlighted zoom area and drag and drop it to the desired position. Zooming and dragging within the Zoom Toolbar is illustrated in Figure LINK. If the user double clicks in the Zoom Toolbar, the initial zooming state is reverted.
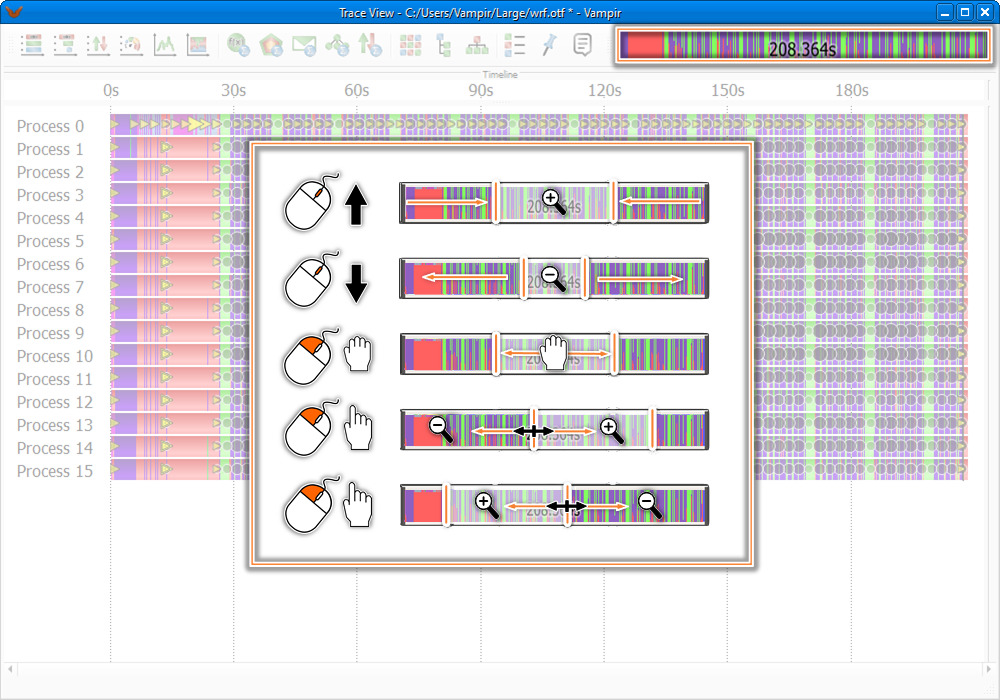
Zooming and Navigation within the Zoom Toolbar: (A+B)Zooming in/out with the Mouse Wheel; (C)Scrolling by Moving the Highlighted Zoom Area; (D)Zooming by Selecting and Moving a Boundary of the Highlighted Zoom Area
The colors represent user-defined groups of functions or activities. Please note that all charts added to the Trace View window will calculate their statistic information according to the selected time interval (zooming state) in the Zoom Toolbar. The Zoom Toolbar can be enabled and disabled with the toolbar's context menu entry Zoom Toolbar.
The Charts Toolbar
| Icon | Name | Description |
| Master Timeline | Section LINK | |
| Process Timeline | Section LINK | |
| Performance Radar | Section LINK | |
| Counter Data Timeline | Section LINK | |
| Function Summary Timeline | Section LINK | |
| Message Summary Timeline | Section LINK | |
| I/O Summary Timeline | Section LINK | |
| Function Summary | Section LINK | |
| Process Summary | Section LINK | |
| Message Summary | Section LINK | |
| I/O Summary | Section LINK | |
| Communication Matrix View | Section LINK | |
| Call Tree | Section LINK | |
| Function Legend | Section LINK | |
| Marker View | Section LINK | |
| Context View | Section LINK |
Icons of the Charts Toolbar
The Charts Toolbar is used to open instances of the available performance charts. It is located in the upper left corner of the Trace View window as shown in Figure LINK. The toolbar can be dragged and dropped to alternative positions. The Charts Toolbar can be disabled with the toolbar's context menu entry Charts.
Table LINK gives an overview of the available performance charts with their corresponding icons. The icons are arranged in three groups, divided by small separators. The first group represents timeline charts, whose zooming states affect all other charts. The second group consists of statistical charts, providing special information and statistics for a chosen interval. Vampir allows multiple instances for charts of these categories. The last group comprises of informational charts, providing specific textual information or legends. Only one instance of an informational chart can be opened at a time.
Properties of the Trace File
Vampir provides an info dialog containing important characteristics of the opened trace file. This Trace Properties dialog can be accessed via the main menu under File -> Get Info. The information originates from the trace file and includes details such as file name, creator, or the OTF version.