Customization
The appearance of the trace file and various other application settings can be altered in the preferences accessible via the main menu entry File -> Preferences. Settings concerning the trace file itself, e.g. layout or function group colors are saved individually next to the trace file in a file with the ending .vsettings. This way it is possible to adjust the colors for individual trace files without interfering with others.
The options Import Preferences and Export Preferences provide the loading and saving of preferences of arbitrary trace files.
General Preferences
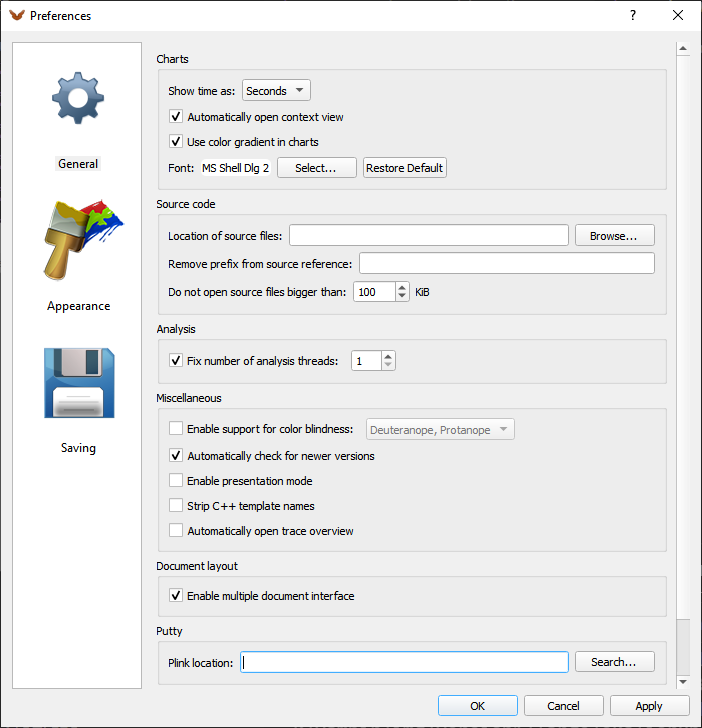
The General settings allow to change application and trace specific values.

General Settings
Show time as decides whether the time format for the trace analysis is based on seconds or ticks.
With the Automatically open context view option disabled Vampir does not open the context view after the selection of an item, like a message or function.
Use color gradient in charts allows to switch off the color gradient used in the performance charts.
The next option allows to change the style and size of the font.
Show source code enables the internal source code viewer. This viewer shows the source code corresponding to selected locations in the trace file. In order to open a source file first click on the intended function in the Master Timeline and then on the source code path in the Context View. For the source code location to work properly, you need a trace file with source code location support. The path to the source file can be adjusted in the Preferences dialog. A limit for the size of the source file to be opened can be set, too.
In the Analysis section the number of analysis threads can be chosen. If this option is disabled, Vampir determines the number automatically by the number of cores, e.g. two analysis threads on a dual-core machine.
In the Miscellaneaous section the user can activate the following functionality. Enable an automatic check for newer versions of Vampir, activate the color blindness support mode, or enable the presentation mode. With the presentation mode active, the mouse pointer is shown using a larger mouse icon that also animates mouse button clicks.
The Document layout option allows to change the application's window behavior. If this option is enabled, all open Trace View windows need to stay in one enclosing main window. If it is disabled, the Trace View windows can be moved freely over the Desktop.
Appearance
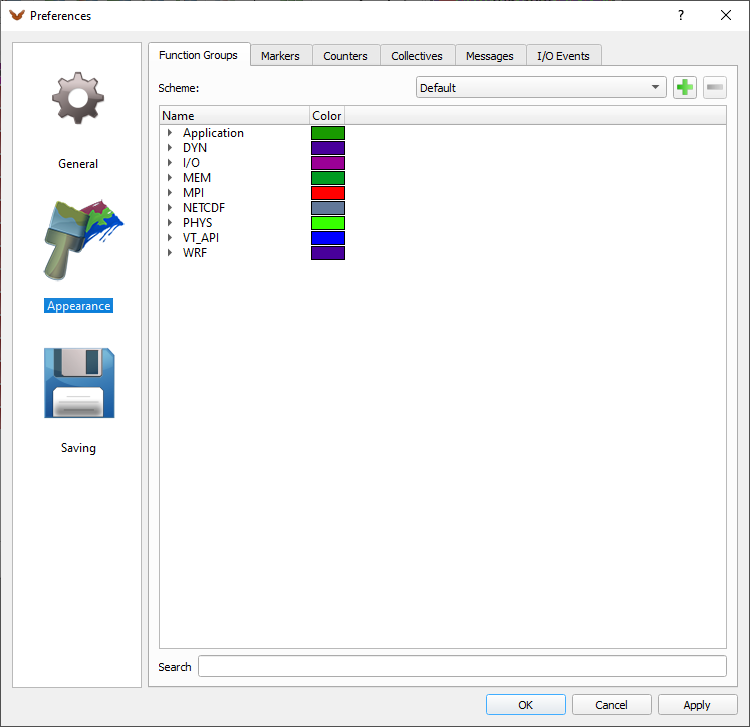
The Appearance settings of the Preferences dialog allow to change the application's color options. Available categories are functions/function groups, markers, counters, collectives, messages, and I/O events. To modify an entry click on its color icon. A color picker dialog will then allow to select the new color. A change of the line width is also available for messages and collectives.
The context menu offers options for setting the colors of all selected functions at once. Set Rainbow Colors will assign all selected functions with sequential color hues. Set Random Colors will assign random colors to all selected functions. The typical selection options are available. Press the Ctrl and A keys to select everything. Left click on a function to select only that function. Hold the Shift key while clicking on another function to select the range between the first clicked and the currently clicked function. Hold Ctrl while clicking to select or deselect a function while keeping the rest of the selection unchanged.

Appearance Settings
In order to quickly find a particular item, a search box is provided at the bottom of the dialog.
Additionally to color modification, the Function Groups dialog also allows regrouping of functions. By using drag and drop, functions can be freely assigned to any function group. To create new function groups use the context menu entry Add Group. Functions can be grouped by the source code file name, where they are defined, by clicking on Group by Source File in the context menu.
A custom grouping can be specified by clicking on Import Group Definitions... in the context menu. The file format for these group definitions is described in section LINK. The definition file can also be named function-groups.cfg and put in the OTF2 trace folder, the one where the traces.otf2 file resides in. If such a function group definition file is detected when loading the trace, the default function grouping will use these definitions.
Custom color and grouping schemes can be stored/removed using the plus/minus buttons at the top of the dialog.
Function Group Definitions File
A custom function grouping can be specified by providing a function group definitions file. If that file is named function-groups.cfg and put in the OTF2 trace folder, it will be read automatically when opening the trace. Alternatively, the function group definitions file can be loaded using the Import Group Definitions... context menu option in the function group appearance settings, see section LINK.
Each function group block may match functions by their name, their canonical mangled name, or by the source code file in which the function was defined. Matching is case sensitive by default. Option blocks can be used to set the matching case sensitivity for all function groups following it.
Trailing and leading whitespaces will be ignored as well as empty lines. If a hashtag (#) is encountered, the rest of the line will be ignored.
If a function matches two different function groups, then by default it will be grouped to the one appearing later in the file. This matching strategy can be changed in the options block.
Here is an example with annotations:
BEGIN_OPTIONS
    # There must not be any whitespace around the equal sign
    MATCHING_STRATEGY=LAST               # FIRST, LAST (default)
    CASE_SENSITIVE_FUNCTION_NAME=YES     # YES (default), NO
    CASE_SENSITIVE_MANGLED_NAME=YES      # YES (default), NO
    CASE_SENSITIVE_SOURCE_FILE_NAME=YES  # YES (default), NO
END_OPTIONS

BEGIN_FUNCTION_GROUP optional custom function group name
    # Multiple functions to match can be separated by comma
    NAME=my_function_1,my_function_2
    # Alternatively, multiple functions can be given on separate lines
    MANGLED_NAME=canonical_fortran_name_to_match_
    MANGLED_NAME=_ZN10NamespaceFoo7MangledCppFunctionNameEi
    SOURCE_FILE_NAME=my_source.*
END_FUNCTION_GROUP

BEGIN_OPTIONS
    CASE_SENSITIVE_FUNCTION_NAME=NO
    CASE_SENSITIVE_MANGLED_NAME=NO
END_OPTIONS
BEGIN_FUNCTION_GROUP MPI Functions
    NAME=MPI_*
    # By not specifying MANGLED_NAME and SOURCE_FILE_NAME,
    # matching will be valid for any source file and mangled name
END_FUNCTION_GROUP

# It is possible to add multiple function group blocks for the same
# function group. This can be used to match name triples exactly.
BEGIN_FUNCTION_GROUP MPI Functions
    NAME=MyMpiFunction
    MANGLED_NAME=_ii3_MyMpiFunction
    SOURCE_FILE_NAME=MpiHelpers.cpp
END_FUNCTION_GROUP
Saving Policy
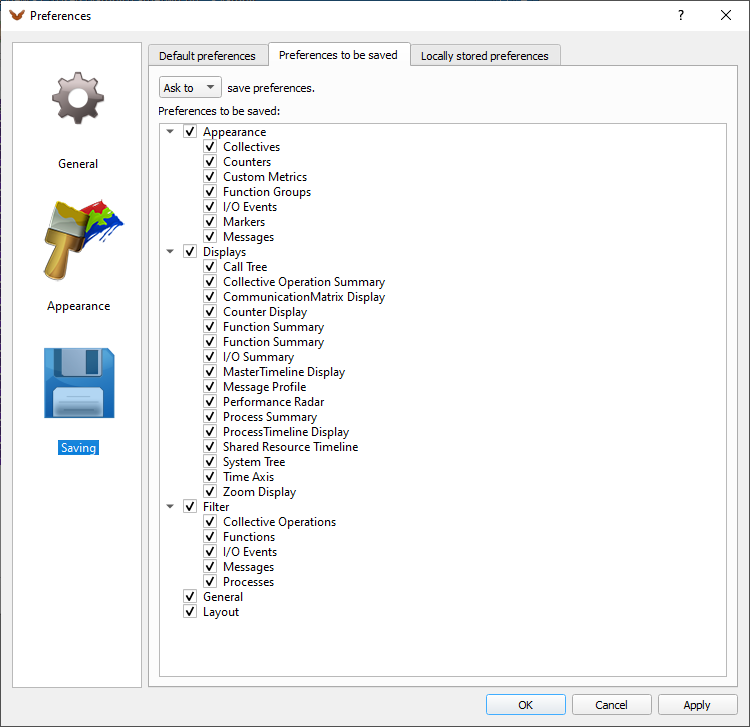
Vampir detects whenever changes to the various settings are made. In the Saving Policy dialog it is possible to adjust the saving behavior of the different components to the own needs.

Saving Policy Settings
In the dialog Saving Behavior you tell Vampir what to do in the case of changed preferences. The user can choose the categories of settings, e.g., the layout, that should be affected by the selected behavior. Possible options are that the application automatically Always or Never saves changes. The default option is to have Vampir asking you whether to save or discard changes.
Usually the settings are stored in the folder of the trace file. If the user has no write access to it, it is possible to place them alternatively in the Application Data Folder. All such stored settings are listed in the tab Locally Stored Preferences with creation and modification date.
Note: On loading Vampir always favors settings in the Application Data Folder.
Default Preferences offers to save preferences of the current trace file as default settings. Then they are used for trace files without settings. Another option is to restore the default settings. Then the current preferences of the trace file are reverted.