Introduction
Performance optimization is a key issue for the development of efficient parallel software applications. Vampir provides a manageable framework for analysis, which enables developers to quickly display program behavior at any level of detail. Detailed performance data obtained from a parallel program execution can be analyzed with a collection of different performance views. Intuitive navigation and zooming are the key features of the tool, which help to quickly identify inefficient or faulty parts of a program code. Vampir implements optimized event analysis algorithms and customizable displays which enable a fast and interactive rendering of very complex performance monitoring data. Ultra large data volumes can be analyzed with a parallel version of Vampir, which is available on request.
Vampir has a product history of more than 25 years and is well established on Unix based HPC systems. This tool experience is also available for HPC systems that are based on Microsoft Windows HPC Server 2008.
Event-based Performance Tracing and Profiling
In software analysis, the term profiling refers to the creation of tables, which summarize the runtime behavior of programs by means of accumulated performance measurements. Its simplest variant lists all program functions in combination with the number of invocations and the time that was consumed. This type of profiling is also called inclusive profiling, as the time spent in subroutines is included in the statistics computation.
A commonly applied method for analyzing details of parallel program runs is to record so-called trace log files during runtime. The data collection process itself is also referred to as tracing a program. Unlike profiling, the tracing approach records timed application events like function calls and message communication as a combination of timestamp, event type, and event specific data. This creates a stream of events, which allows very detailed observations of parallel programs. With this technology, synchronization and communication patterns of parallel program runs can be traced and analyzed in terms of performance and correctness. The analysis is usually carried out in a postmortem step, i.e., after completion of the program. It is needless to say that program traces can also be used to calculate the profiles mentioned above. Computing profiles from trace data allows arbitrary time intervals and process groups to be specified. This is in contrast to profiles accumulated during runtime.
The Open Trace Formats OTF and OTF2
The Open Trace Formats have been designed as well-defined trace formats with open, public domain libraries for writing and reading. This open specification of the trace information enables analysis and visualization tools like Vampir to operate efficiently at large scale. The formats address large applications written in an arbitrary combination of Fortran77, Fortran (90/95/etc.), C, and C++.

Representation of Streams by Multiple Files
The original OTF uses a special ASCII data representation to encode its data items with numbers and tokens in hexadecimal code without special prefixes. That enables a very powerful format with respect to storage size, human readability, and search capabilities on timed event records.
In contrast to that, OTF2 relies on a binary representation of the data, which simplifies and accelerates parsing.
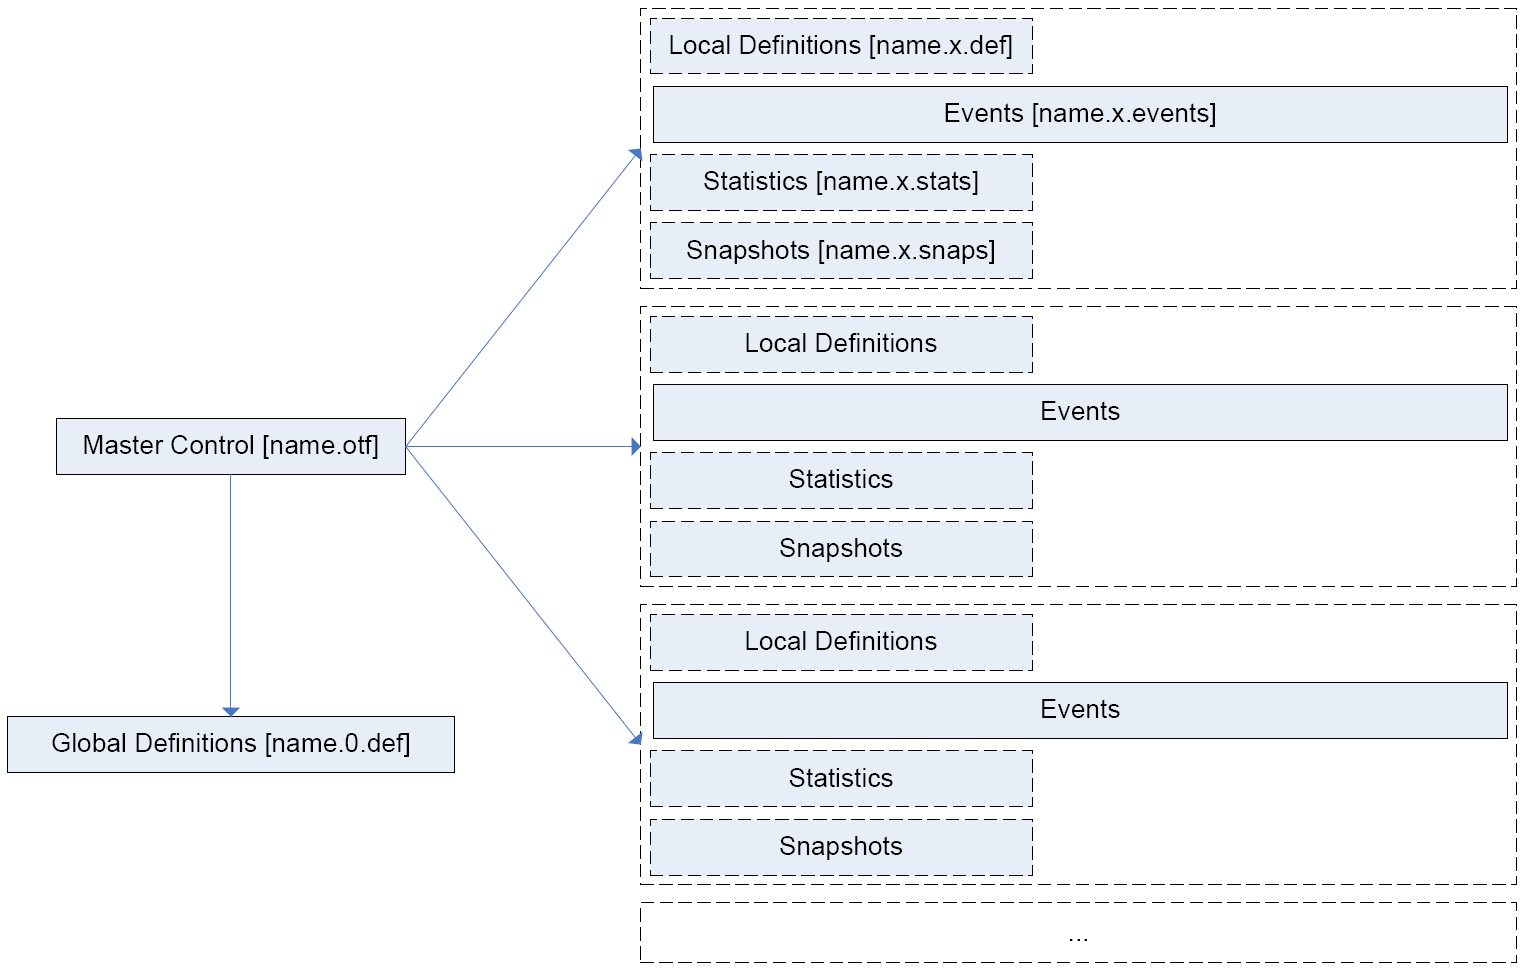
In order to support fast and selective access to large amounts of performance trace data, OTF is based on a stream-model, i.e. single separate units representing segments of the overall data. OTF streams may contain multiple independent processes whereas a process belongs to a single stream exclusively. As shown in Figure LINK, each stream is represented by multiple files which store definition records, performance events, status information, and event summaries separately. A single global master file holds the necessary information for the process to stream mappings. The master file is always named {name}.otf[2]
Note: Open the master file (*.otf[2]) to load a trace. When copying, moving or deleting traces it is important to include all files with the same name prefix. If not, Vampir will render the whole trace invalid! Good practice is to hold all files belonging to one trace in a dedicated directory.
Detailed information can be found in the Open Trace Format documentation for Open Trace Format (OTF) and Open Trace Format 2 (OTF2).
The Chrome Trace Event Format
Google developed its own event trace format to be used for Android and browser performance analysis. This trace format is JSON-based and hence very easily writable. This ease of use led to the adoption of the trace format by other monitoring software. The fact that Chrome browser provided a convenient way to visualize these traces exacerbated this adoption. Though in recent years such traces are also produced by widespread frameworks which are now common in HPC environments too. Such frameworks are AI-focused like PyTorch and TensorFlow, but also vendor-specific tools for performance analysis of accelerator-based programming. The trace format is not well suited for parallel processing, but the event data might nevertheless exceed the usual resources of a browser-based visualization. Vampir can load such traces in both uncompressed (*.json) and compressed (*.json.gz) forms. Though, as the format is rather openly specified, not all features from all known producers are supported. Currently supported are function (B, E, X), counter (C), and flow (s, t, f) events.
Detailed information can be found in the Trace Event Format documentation.
Vampir and Windows HPC Server 2008
The Vampir performance visualization tool usually consists of a performance monitor (e.g., Score-P, see Section LINK or VampirTrace, see Section LINK) that records performance data and a performance GUI, which is responsible for the graphical representation of the data. In Windows HPC Server 2008, the performance monitor is fully integrated into the operating system, which simplifies its employment and provides access to a wide range of system metrics. A simple execution flag controls the generation of performance data. This is very convenient and an important difference to solutions based on explicit source, object, or binary modifications. Windows HPC Server 2008 is shipped with a translator, which produces trace log files in Vampir's Open Trace Format (OTF). The resulting files can be visualized with the Vampir performance data browser.