Compare View
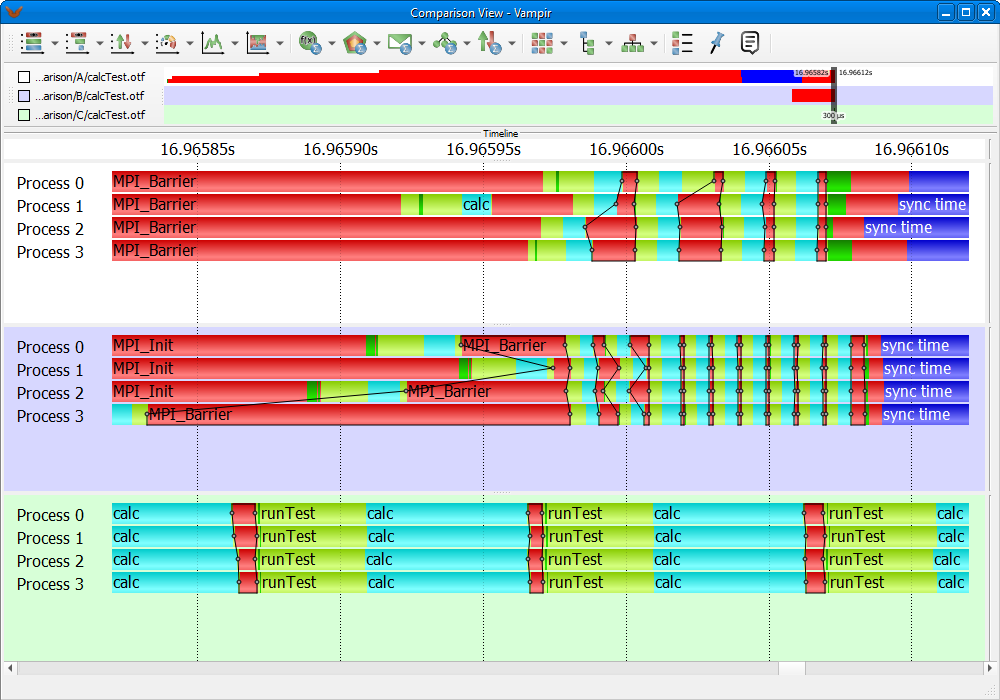
Compare View
All comparison features are provided in the Compare View window, depicted in Figure LINK.
This section introduces the Compare View window and explains its usage. It illustrates the functionality with the help of screen shots. For this purpose the comparison of three trace files is demonstrated step by step. The three example trace files shown are measurements of one test application, performing ten iterations of simple calculations, run on three different machines.
Starting the Compare View
The fist step in order to compare trace files in Vampir is to load the respective files. Each trace file can be loaded one after another via File -> Open... in the main menu. Figure LINK shows Vampir with three open trace files.
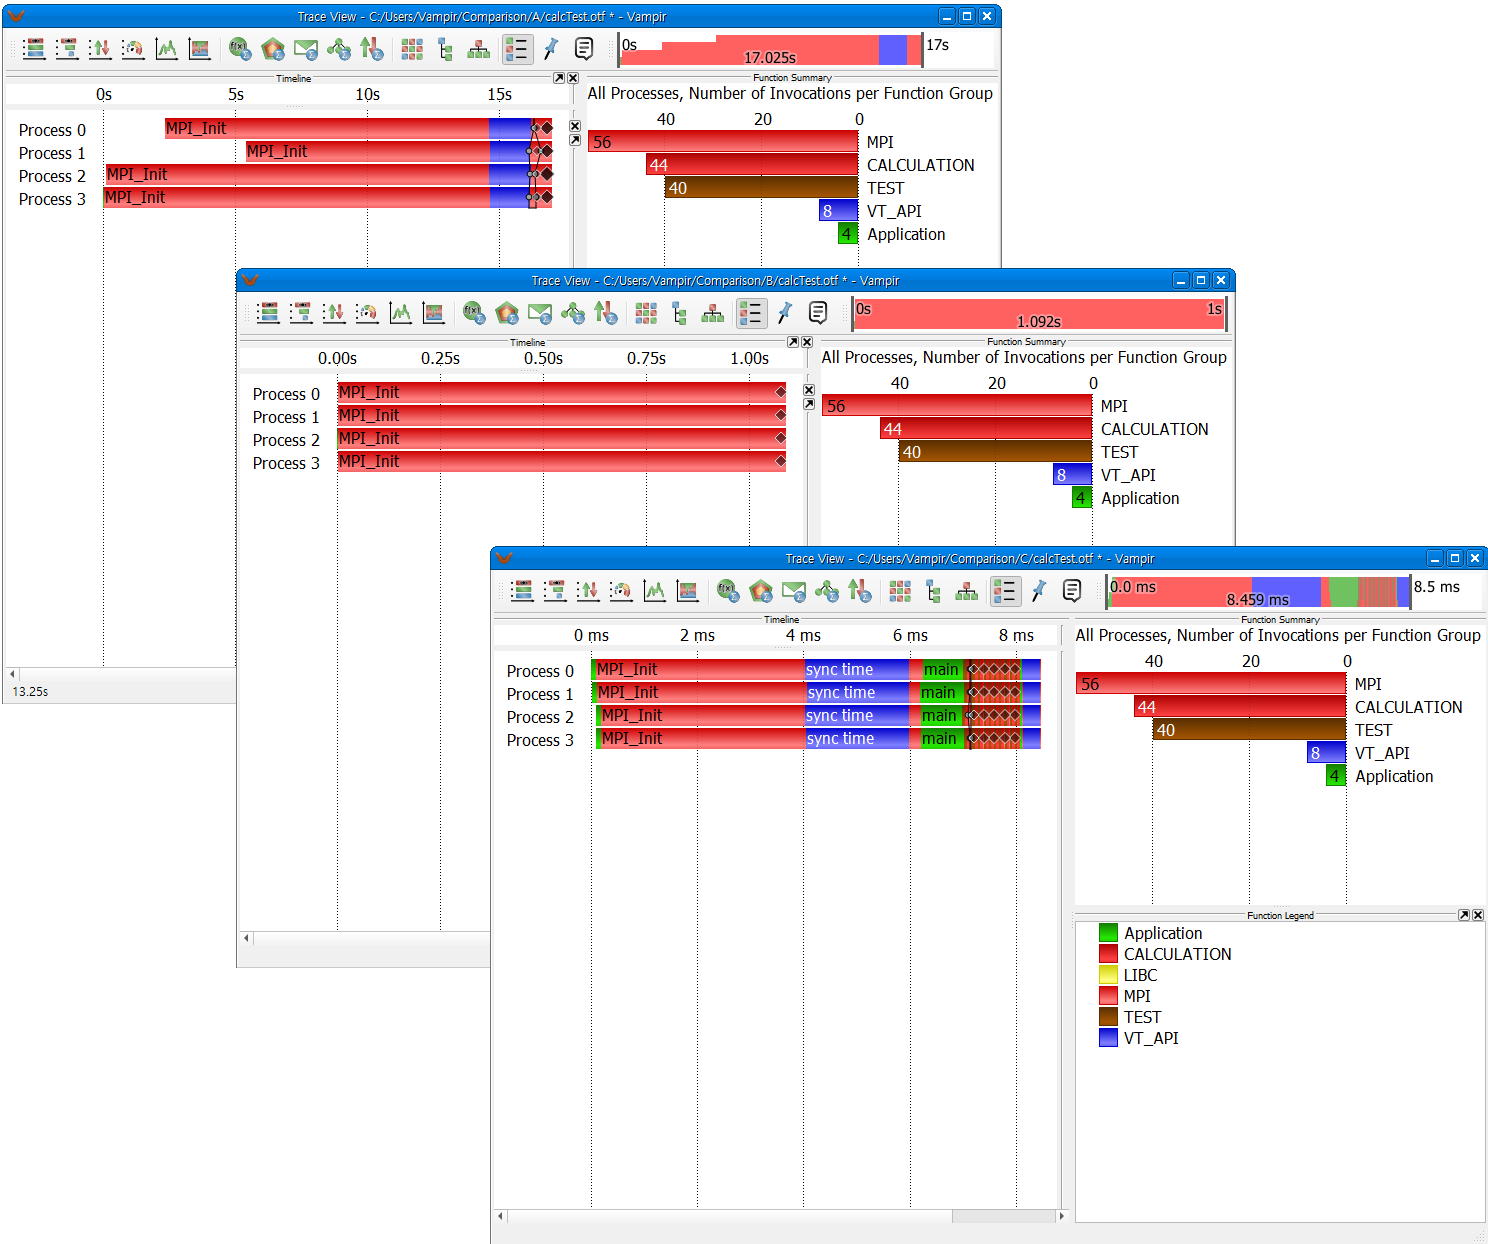
Vampir with three open trace files
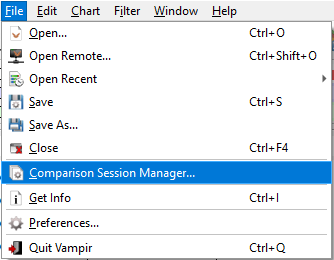
Now, the Compare View can be opened. This is done from the main menu by selecting File -> Comparison Session Manager, see Figure LINK.
Figure LINK shows the opened Compare View. As can be seen by the navigation toolbars all three open trace files are included in the Compare View. The files in the view are sharing one coupled zoom. The usage of charts and zooming in this view is described in Section \ref{sec:charts}.
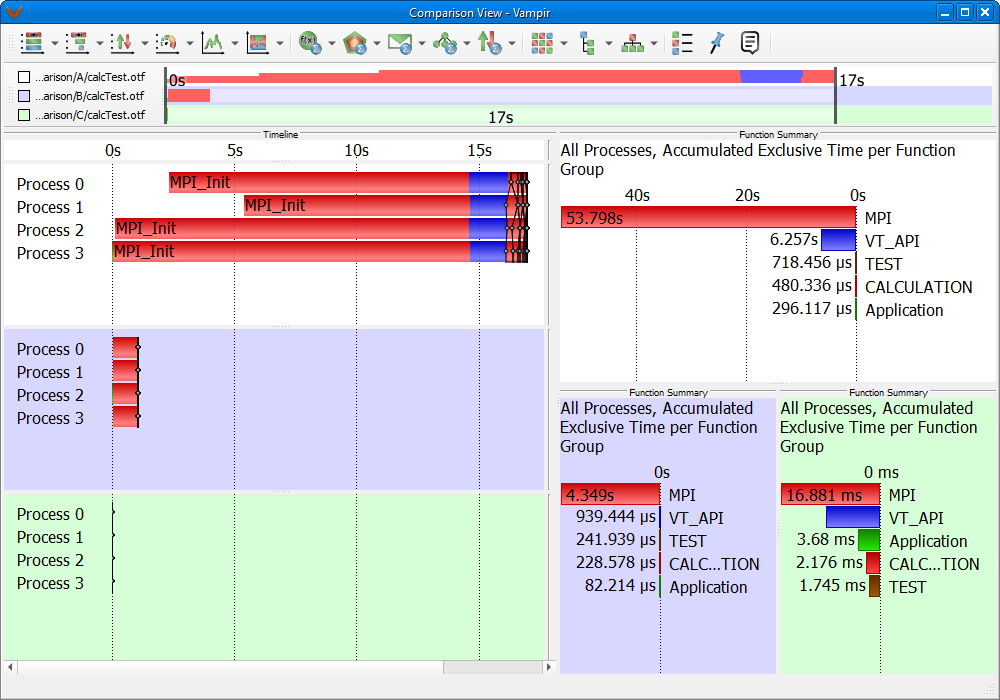
Open Compare View
Usage of Charts
For the comparison of performance metrics the Compare View provides all common charts of Vampir. In contrast to the ordinary Trace View the Compare View opens one chart instance for each trace file, i.e., with three open trace files, one click on the Master Timeline icon opens three Master Timeline charts. Also, in order to distinguish the same charts between the trace files, all charts belonging to one trace file have a special individual background color. Figure LINK depicts a Compare View with open Master Timeline, Process Timeline, and Function Summary charts.
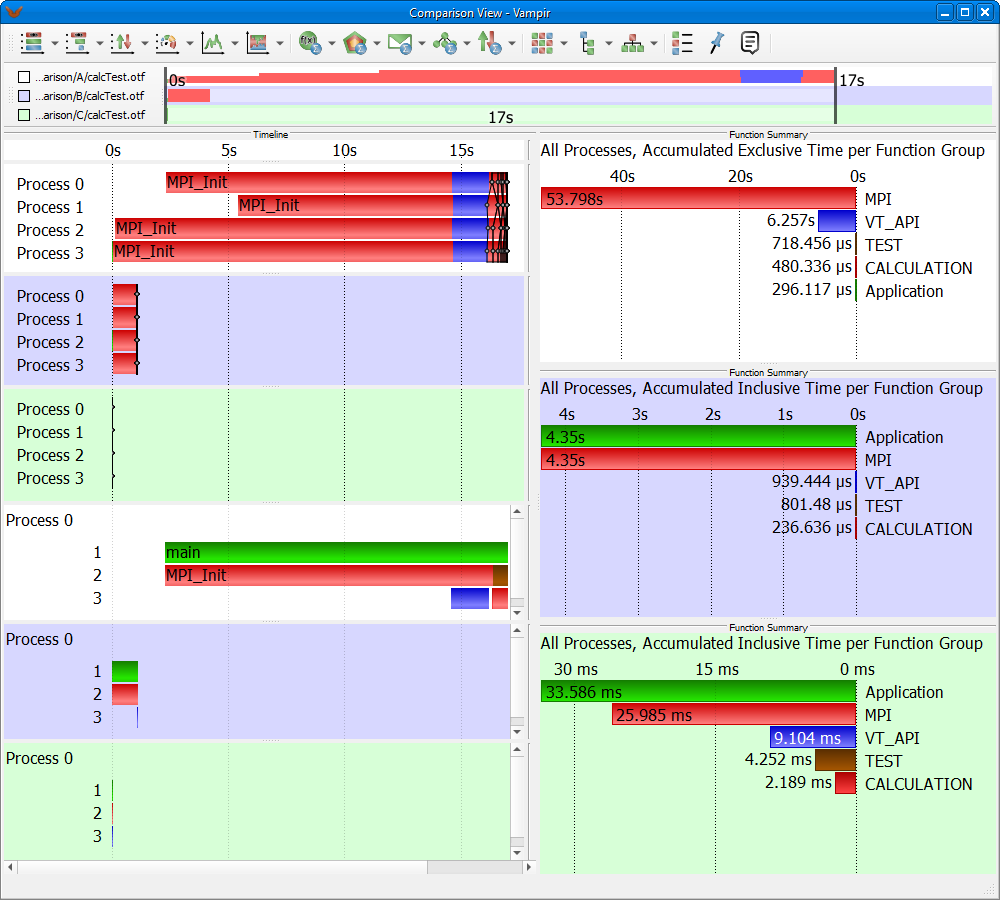
Compare View with open charts
All charts work the same way as in the Trace View. Due to the fact that the Compare View couples the zoom of all trace files, the charts can be used to compare performance characteristics.
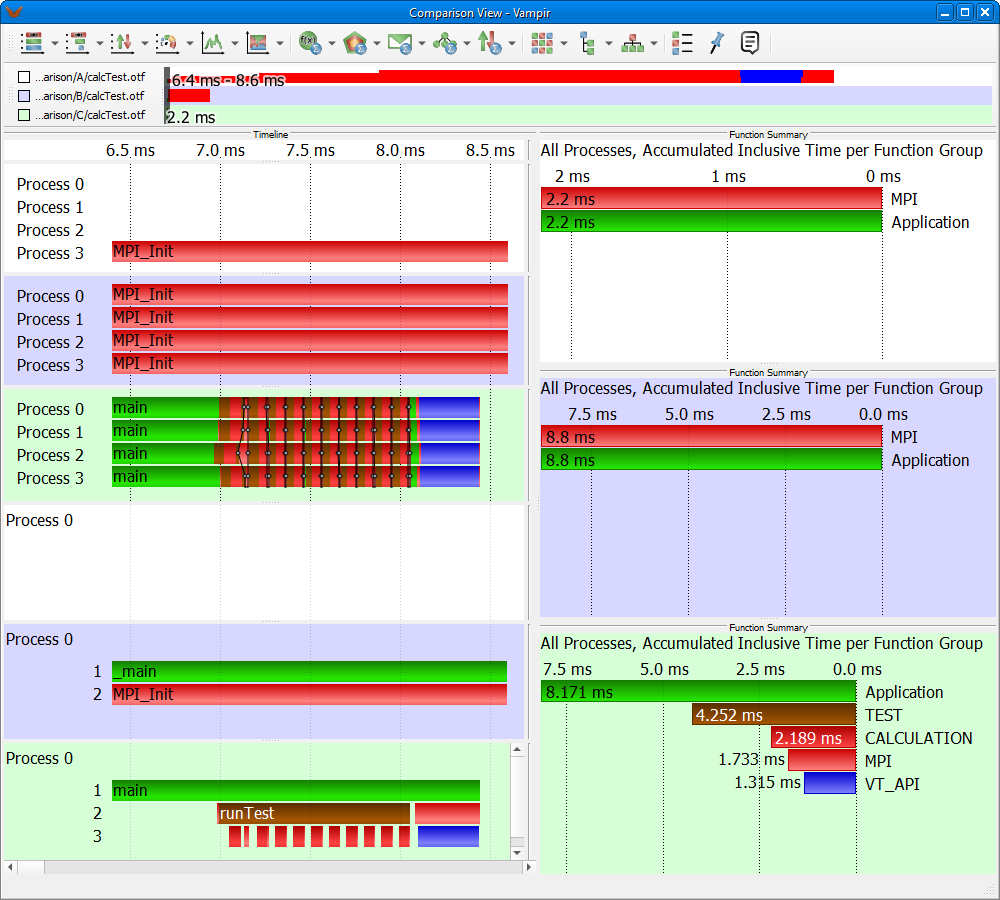
Zoom to compute iterations of trace C
As can be seen in Figure LINK, trace A has the biggest duration time. The duration of trace C is so short that it is almost not visible. Zooming into the compute iterations of trace C would make them visible but would also only reveal the MPI_Init phase of trace A and B, see Figure LINK. In order to compare the compute iterations the trace files need to be aligned properly. This process is described in Section \ref{sec:alignment}.
Alignment of Multiple Trace Files
The Compare View functionality to shift individual trace files in time allows to compare areas of the data that did not occur at the same time. For instance, in order to compare the compute iterations of the three example trace files these areas need to be aligned to each other. This is required due to the fact that the initialization of the application took different times on the three machines.
Context menu controlling the time offset
Alignment in the Navigation Toolbar
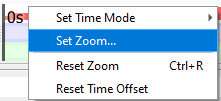
There are several ways to shift the trace files in time. One way is to use the context menu of the Navigation Toolbar. A right click on the toolbar reveals the menu shown in Figure LINK. Here the entry Set Time Offset allows to manually set the time offset for the trace file. The entry Reset Time Offset resets the offset.
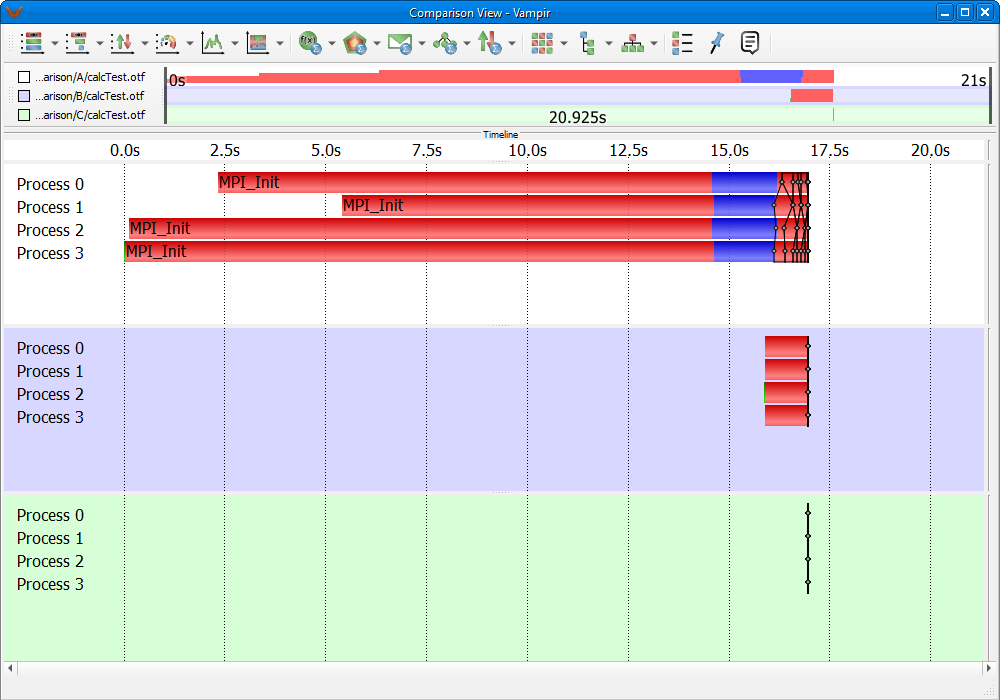
The easiest way to achieve a coarse alignment is to drag the trace file in the Navigation Toolbar itself. While holding the Ctrl (Cmd on Mac OS X) modifier key pressed the trace can be dragged to the desired position with the left mouse button. In Figure LINK the compute iterations of all example trace files are coarsely aligned.
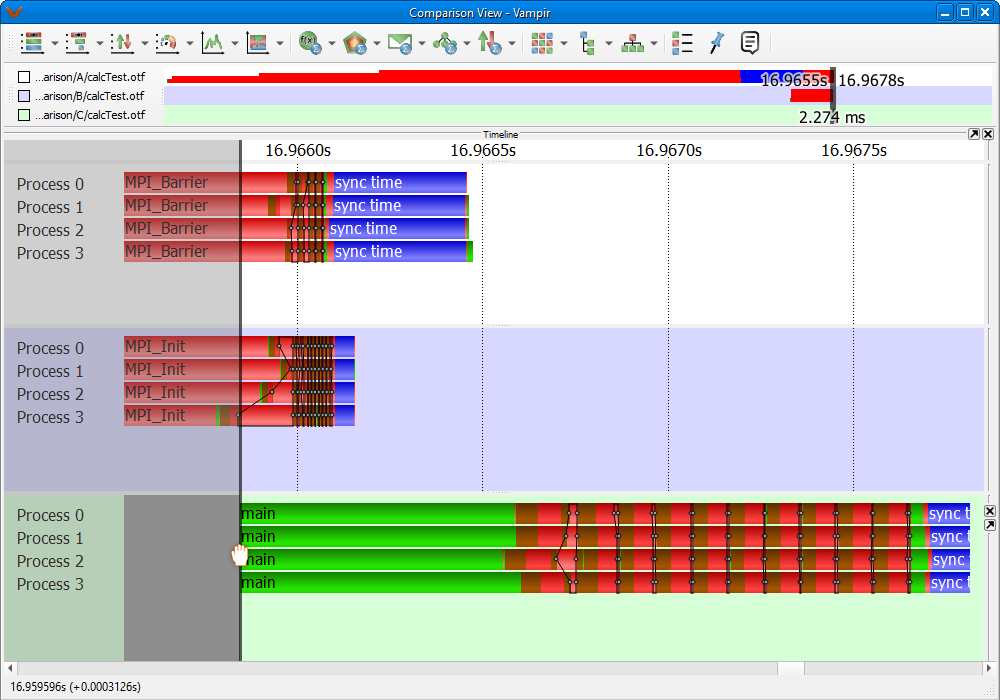
Alignment in the Master Timeline
After the coarse shifting a finer alignment can be done in the Master Timeline. Therefore the user needs to zoom into the area to compare. Then, while keeping the Ctrl (Cmd on Mac OS X) modifier key pressed, the trace can be dragged with the left mouse button in the Master Timeline. Figure LINK depicts the process of dragging trace B to the compute iterations of trace A. As can be seen in the Figure LINK, although the initialization of trace A took the longest time, this machine was the fastest in computing the iterations.
Usage of Predefined Markers
The Open Trace Format (OTF) allows to define markers pointing to particular places of interest in the trace data. These markers can be used to navigate in the trace files. For trace file comparison markers are interesting due to their potential to quickly locate places in large trace data. With the help of markers it is possible to find the same location in multiple trace files with just a few clicks.
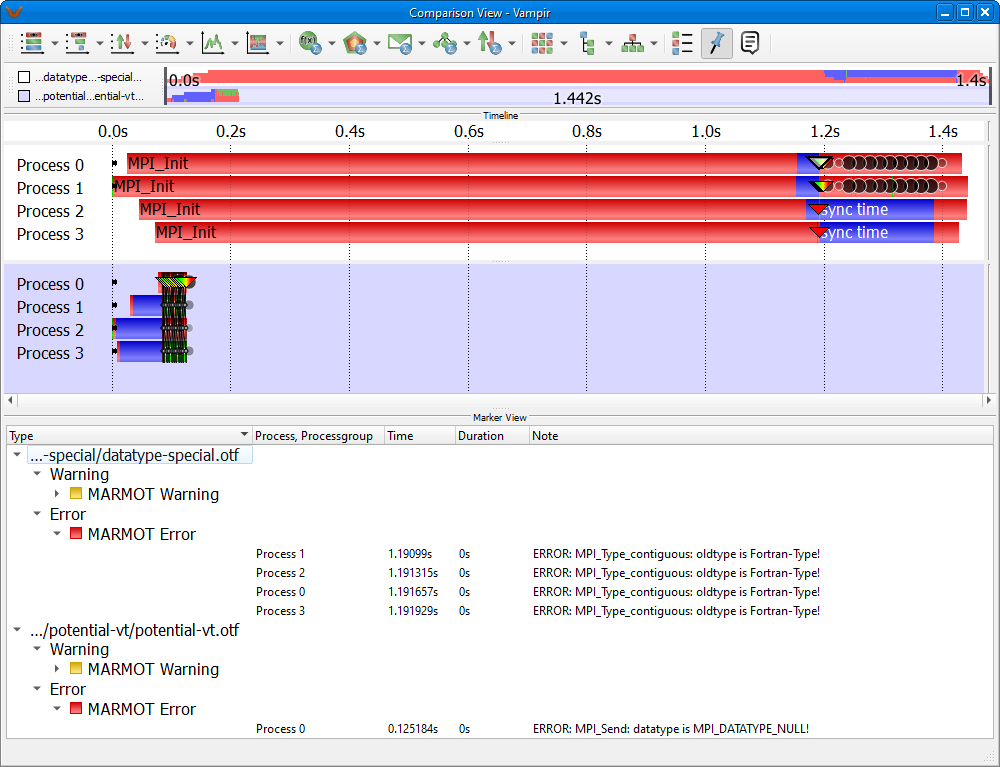
Open Marker View
First step in order to use markers is to open the Marker View. Figure LINK shows a Compare View with an open Marker View for each trace file. After a click on one marker in the Marker View the selected marker is highlighted in the Master Timeline and the Process Timeline.
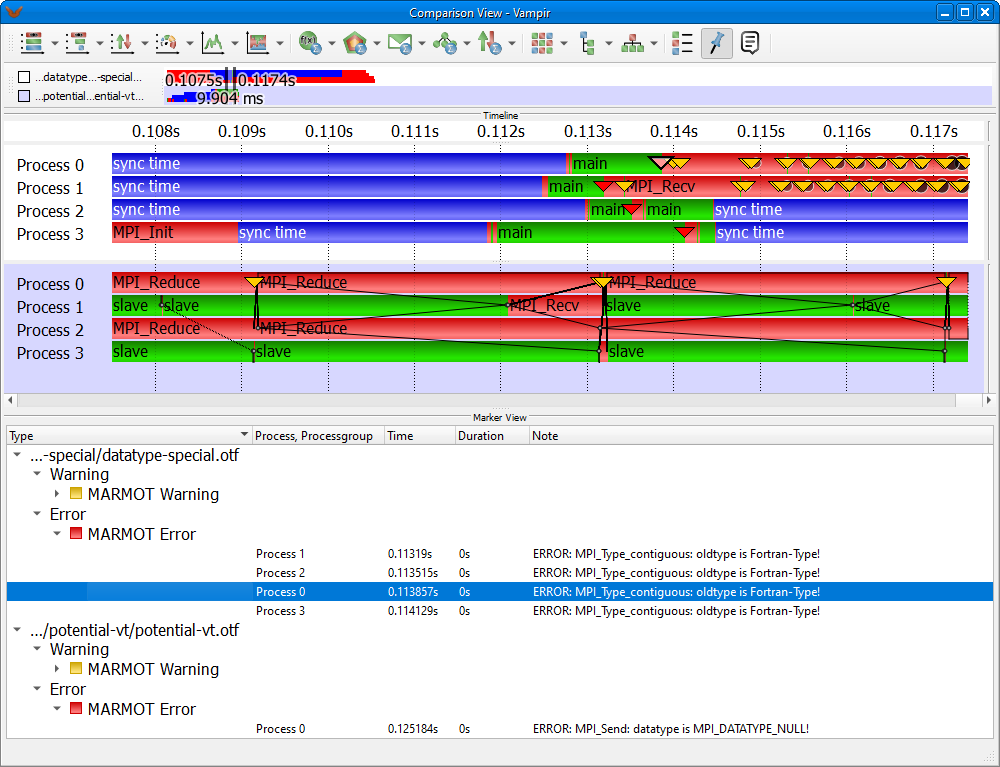
Jump to marker in the Master Timeline
Another way to navigate to a marker in the timeline displays is to use the Vampir zoom. If the user zoomed in the Master Timeline or Process Timeline into the desired zooming level, then a click on a marker in the Marker View will shift the timeline zoom to the marker position. Thus, the marker appears in the center of the timeline display, see Figure LINK.
