Vampir 10.0.0 released
03Dec
2021
We are pleased to announce the feature release of Vampir 10.0.0.
This major release introduces multiple new features but also is not compatible with prior versions of Vampir. Please use only the same major version for the Client and Server.
What's New Dialog
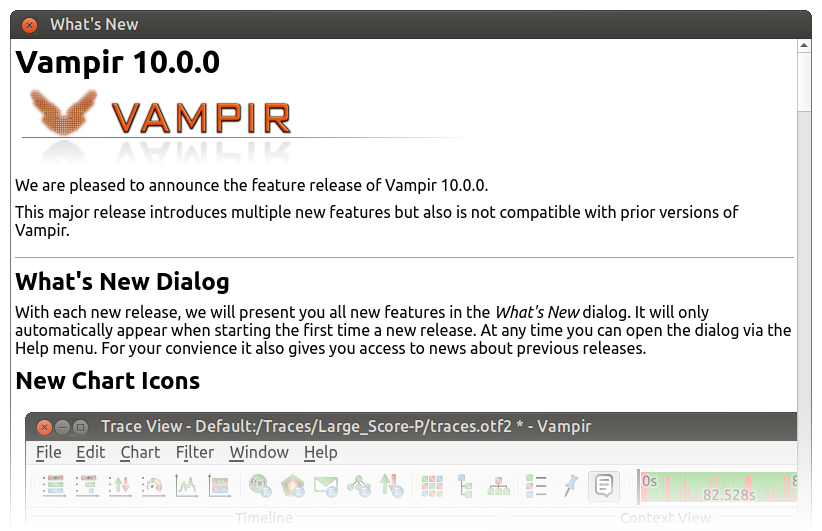
With each new release, the What's New dialog we will present all new features. It will only automatically appear when starting a new release for the first time. The dialog can be opened via the Help menu at any time. For convenience, it also gives access to news about previous releases.
New Chart Icons
![]()
The new icons are harmonized in style and are also vectorized for better rendering on high-DPI displays.
Improved Server Protocol
The server protocol was newly implemented and revised. This removed many limitations from the old one. Most prominently, it is now possible to pass 64-bit integers to the client. Data sizes for individual events are not limited to 2 GiB anymore.
The server queries grew over the many years of Vampir's existence. This will make it possible to introduce new features more easily in coming releases.
Unfortunately, these changes to the protocol made this release incompatible with previous releases. To make the transition more smoothly, Vampir 9.11 will be maintained longer than usual.
Support new OTF2 3.0 features
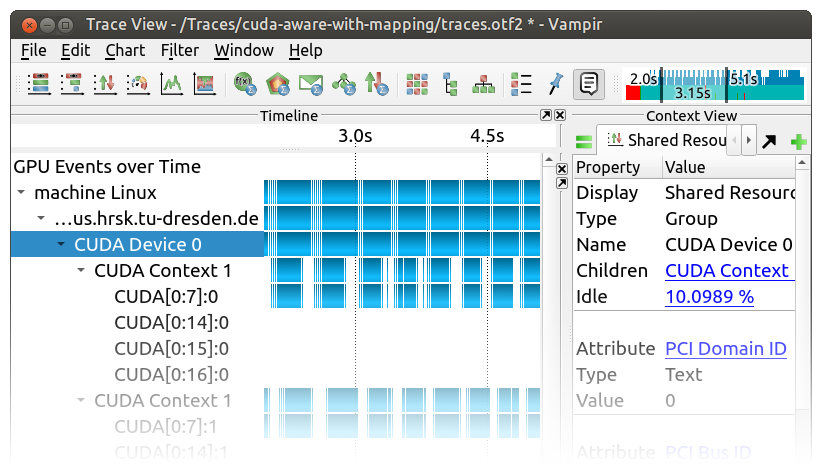
Vampir already supports most of the new features of the upcoming OTF2 3.0 release. In particular:
- Accelerators in the system tree
- Non-blocking collective operations on communicators
- Support for MPI inter-communicators
Step Size in the Summary Timeline
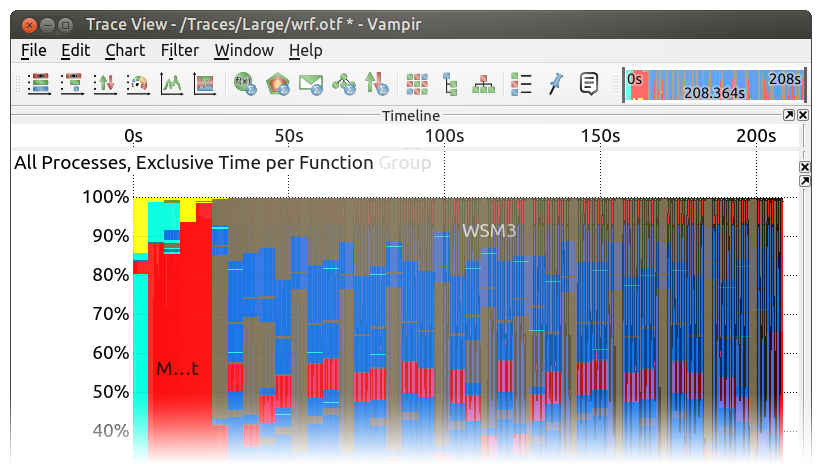
The Step Size used for the profile slices in the Summary Timeline can be selected in the range from 1 to 16 now. Drawing lines around groups/functions is now also optional. This helps, if groups have the same color.
Recent Files Dialog
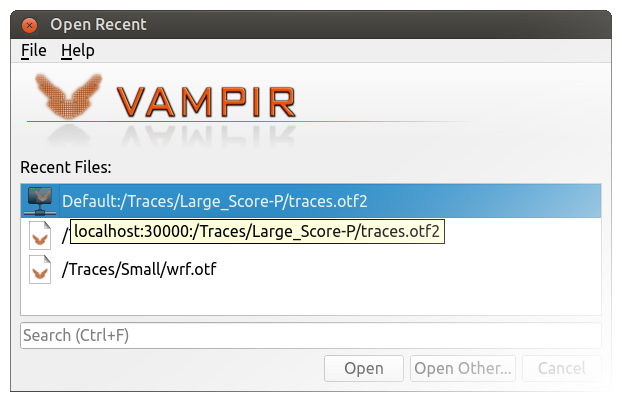
The Recent Files list has now a search field at the bottom. Additionally added more information about the remote server to the Recent Files lists file format. The actual host and port of a remote server are shown in a tooltip now.
Collective Operation Bursts
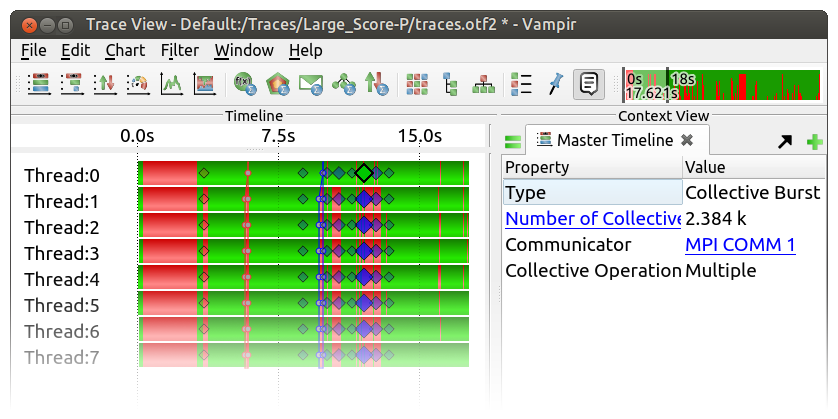
Collective operations are now collated into bursts in the Master Timeline when too many of them occur in a specific interval. These bursts are depicted as rhombuses.
In general, bursts for messages, collective operations, and I/O operations provide more information in Context View.
They will also be colored like individual events if the property is common to all events of the burst.
In the screenshot above, all events in the selected collective operation burst operate on communicator MPI COMM 1.
Thus, it is also colored blue, like individual events.
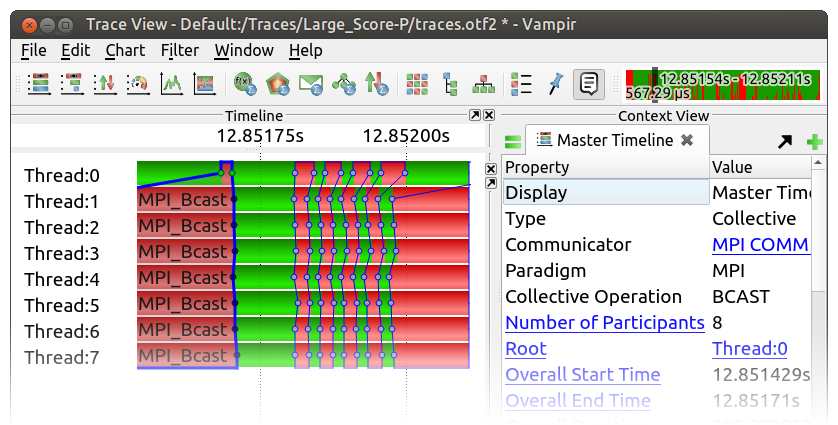
Additionally, for collective operations, they are also shown in the Master Timeline even when only their end is visible in the current time interval.
Summarizations in the Performance Overlay
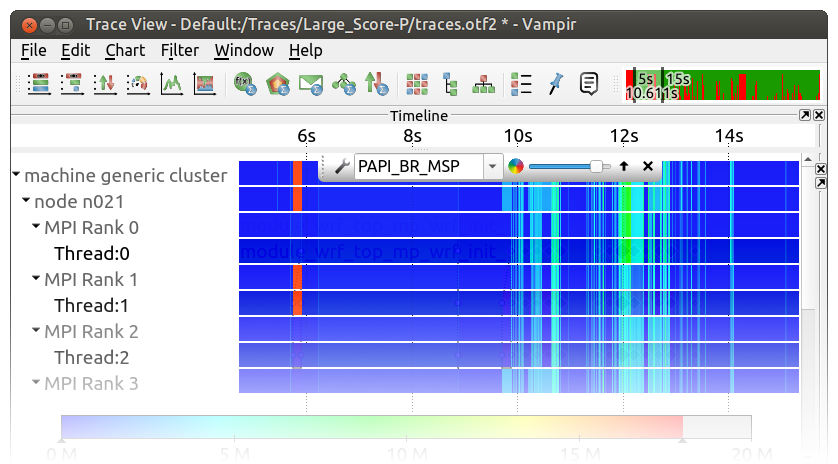
When grouping is active in the Master Timeline and the Performance Overlay shows a metric, the values are also summarized into their parent groups.
This is similar to selecting Summarize multiple measuring points in the Select Metric dialog.
Note how in the screenshot the metric value from Thread:1 is propagated up into group MPI Rank 1, node n021, and finally into the root group.
Group by Type in the Message Summary
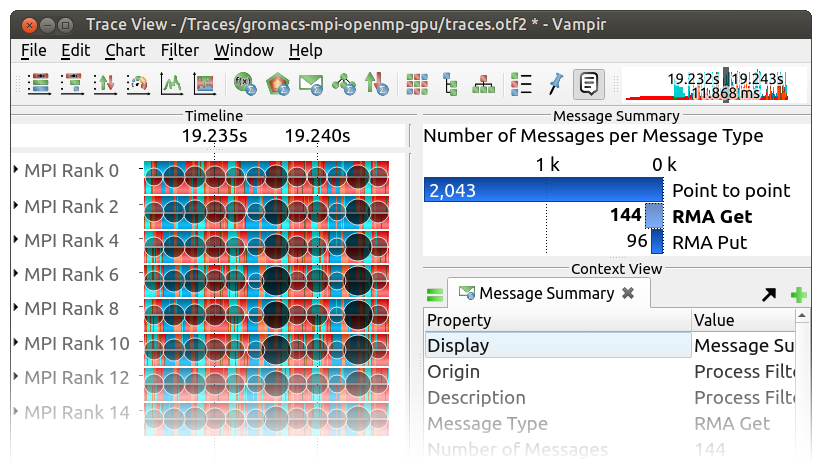
The Message Summary provides a grouping by message type now. This is in particular helpful for applications with RMA atomic operations.
Find in the System Tree Display
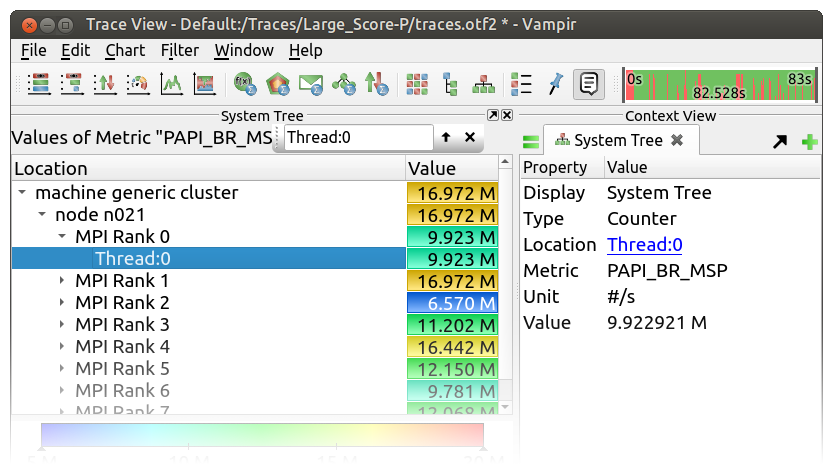
The System Tree display can now also find entities in the tree by bringing up the Find widget.
Support OpenSSH Client on Windows
Vampir is able to use the OpenSSH client ssh.exe on the Windows platform now.
As usual, if the executable cannot be found automatically, it can be set in the preference dialog.