Vampir meets SC '10
 01
01Nov
2010
Welcome to the November edition of Vampir News, designed to keep you informed of recent developments of our performance analysis environment. This includes the tracing tool Vampir- Trace as well as the visualization and analysis framework of Vampir 7.
VampirTrace 5.10
The new VampirTrace 5.10 introduces additional methods of acquiring performance data as well as a growing set of highly scalable VampirTrace tools. As of this release, VampirTrace also supports automatic source code instrumentation using PDT/TAU. The advantages of this form of event logging are the possibility to filter certain events (like C++ STL constructors) while – in contrast to compiler instrumentation – enabling full compiler optimization. The VampirTrace tools vtfilter and otfmerge are now also available in MPI parallel versions to allow filtering, filter generation, and merging of trace files from very large runs. Additionally, the counting of transferred bytes for collective operations was changed from a derived global count to a more exact per-rank information. A preview of VampirTrace with the capability to capture OpenCL events has also been made publically available.
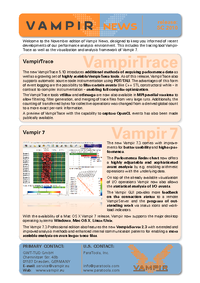
Vampir 7.3
The new Vampir 7.3 comes with improvements for better usability and higher performance. The Performance Radar chart now offers a highly adjustable and sophisticated event analysis by e.g. enabling arithmetic operations with the underlying data. On top of the already available visualization of I/O operations Vampir now also allows the statistical analysis of I/O events. The Vampir GUI provides more feedback on the connection status to a remote VampirServer and the progress of outstanding work via status icons and workload indicators. With the availability of a Mac OS X Vampir 7 release, Vampir now supports the major desktop operating systems Windows, Mac OS X, Linux/Unix. The Vampir 7.3 Professional edition also features the new VampirServer 2.3 with extended and improved analysis methods and enhanced internal communication patterns for enabling a more scalable analysis on even larger trace files.