Vampir 10.3.0 released
05Jun
2023
We are pleased to announce the feature release of Vampir 10.3.0.
This major release introduces multiple new features.
Noteworthy Changes:
Chrome Trace Support
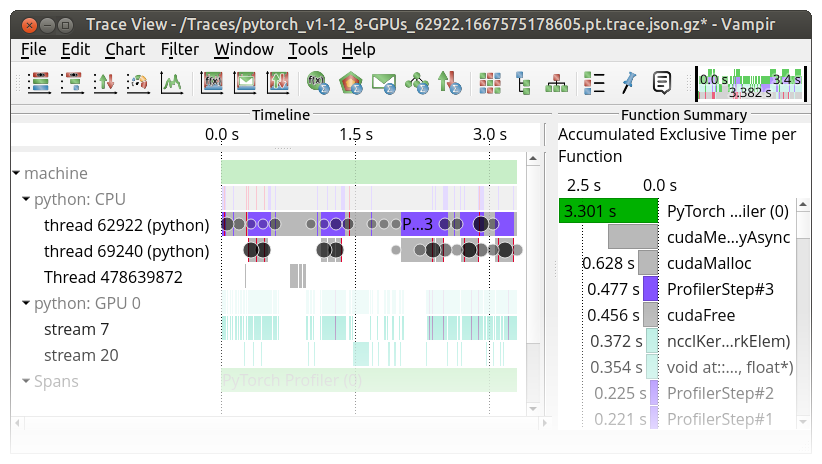
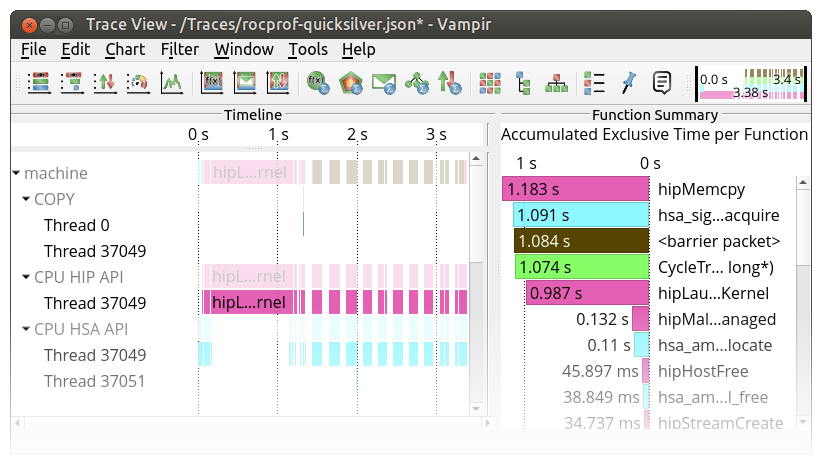
The Trace Event format, also referred to as Chrome Trace (Event) format, was initially developed for tracing of Chrome itself and tracing of websites rendered with Chrome. It is a JSON-based format, which can additionally be compressed with gzip. By customer request, Vampir now supports loading and viewing such files, in both compressed and uncompressed forms. In particular, Chrome Trace format support has been tested for traces generated by:
rocprof, which is part of the ROCm Developer Tools- PyTorch Profiler
- TensorFlow Profiler
- Chrome DevTools
Summary Timeline Displays for I/O Events and Messages

Vampir added two new Summary Timeline displays for I/O events and messages. They feature the same functionality as the already existing Function Summary Timeline display and similar metrics to the corresponding Summary displays.

File Paths as Directory Tree

File paths are now converted into a directory tree in the Shared Resource Timeline display and the File Name selection dialogs.

Improved drag-and-drop Experience

Add drag-and-drop support for process filters, functions, function groups, counters, metrics, and show a drop indicator explaining the effect of the drop.

Other notable changes include
- Batch coloring options have been added to the I/O color preferences, similar to the batch coloring options already available for the function colors.
- Support for specifying the path to a trace folder has been added. In that case, the anchor file (
.otf2,.otf, or.json[.gz]) inside that folder will be opened if it is unambiguous. - Program arguments recorded with Score-P 8.1+ can be viewed by selecting a process, which will list the program arguments as attributes in the Context Information display.
- Show the caller/callee information from the call tree in the Context Information display instead of in the Call Tree display to save space and improve data export.
- Add option to select all I/O paradigms in the I/O Summary and I/O Summary Timeline context menus.
- Show identical file paths to the same file on a global file system as a single aggregated value in the I/O Summary display when grouped by filename.
- Disable the gradient coloring by default. It can still be enabled in the preferences just as before.
- Upgrade from Qt 5.15 to Qt 6.5.